How to Analyse Your Athlete’s Speed – Part 2
In case you missed it
In part one of this two-part blog series I went through Speedwork’s Linear speed report. You can read the blog article here.
In today’s blog I’ll be looking at the COD report. This is a more recent addition to Speedwork’s analysis and it’s something I have been really excited to see ever since I knew they were going to offer this service to compliment the linear speed report.
COD Report
Speedworks have become known for their ability to simplify the process of coaching linear speed using their PSR system. It should come as no surprise that over time, some of their clients in team sports started to ask about deceleration ability. It has certainly become a hot topic in recent years. So when we talk about deceleration and COD, in comparison to linear speed, it is probably an even easier sell to coaches and tennis players on the value of being able to perform a 180 degree COD effectively and efficiently.
I must admit, I’ve been studying a lot of the COD research over recent years and must give credit to the likes of Damian Harper, Thomas Dos Santos and Dr Sophia Nimphius. I’m pointing this out just to say that it has definitely helped me to digest some of the concepts in the report feedback that follows. So, if it feels a little confusing you can always reach out to me and I’ll try my best to help!
In the linear report I cut straight to the report. For the COD report I feel it would be better to set the scene with a brief overview of some key concepts related to COD performance. As I said, researchers like Damian have done so much to help coaches like myself visualise what is going on in deceleration during a 180 degree cut.
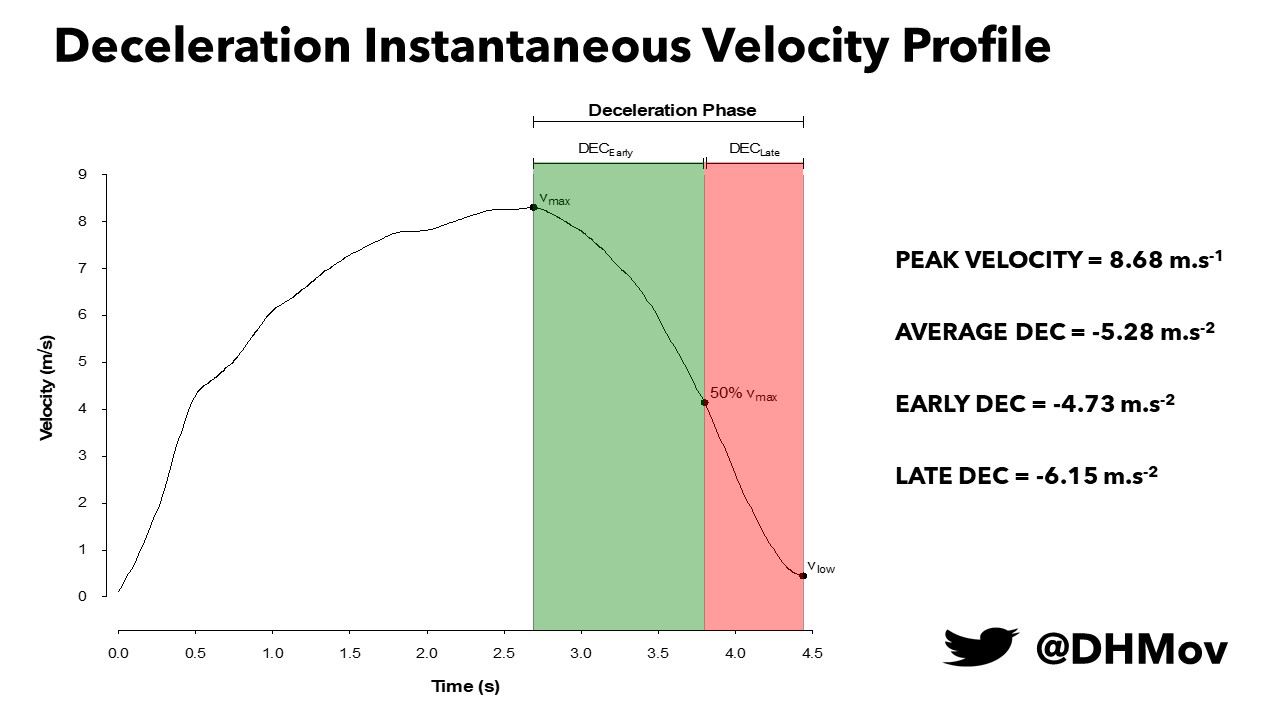
In the research they break the deceleration phase into EARLY vs LATE. Basically, the point where you are no longer accelerating and increasing your velocity is known as your max velocity. This also signifies the start of the deceleration phase. Researchers have split the period from max velocity to lowest velocity into two phases (Vmax to 50% Vmax is EARLY phase; 50% Vmax to Vlow is LATE phase).
When researchers talk about good deceleration ability they talk about doing more of the deceleration in the “early phase.”
The moment you choose to start decelerating we want you to slam on the brakes EARLY and HARD! No matter how good you are at decelerating the late deceleration phase will have a higher rate of deceleration. But we are aiming for a ratio as close to 1:1 as possible.
If you do slam on the brakes HARD you should also have an overall higher average deceleration. From my personal experience, you want this number to be 6 m/s2 or higher. For the S&C coaches out there we are talking about coaching interventions that will promote high rates of eccentric force absorption.
Simple enough right?
Here’s where it gets complicated.
When coaches talk about good deceleration, they talk about stopping “later” in the approach.
So in terms of stopping distance, they want this to be smaller as this indicates you have started braking later in the run. Can you see how the use of the words early and late could be confusing, depending on whether you are referring to the deceleration phase or the distance out from the COD?
I have told my coaches that since most athletes will not be aware of this EARLY vs LATE deceleration phase concept, focus on the words LATER, HARDER, FASTER. Conceptually athletes can understand what you mean by stopping “later” in the 10m approach. Our best athletes are able to slam on the brakes from 3 metres away from the turn at a speed approaching their 10m sprint speed. See below for our elite norms.
| Male 10-0-5 <2.35sec | Female 10-0-5 <2.45sec | ||
| 3m distance to stop from 5.76m/s | |||
| Aim for Touchdown distance >0.5 standing height | |||
So let’s take a look at the latest COD Speed report released by Speedworks in 2025 (V5)
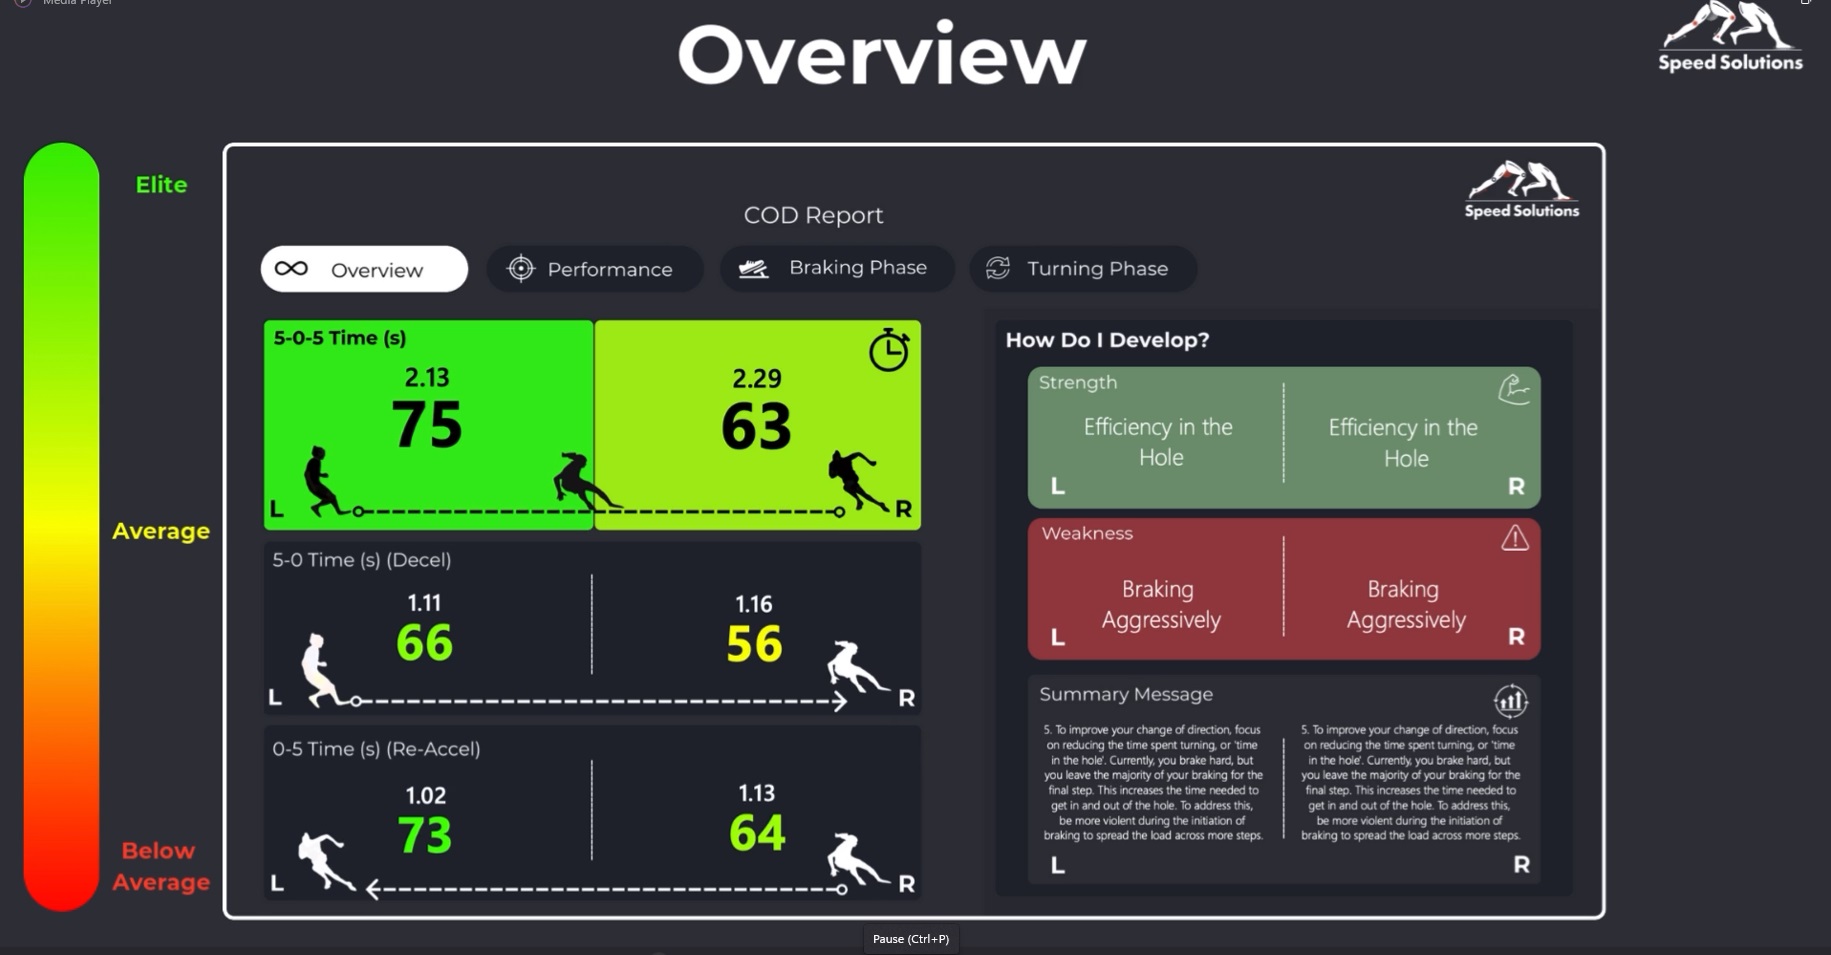
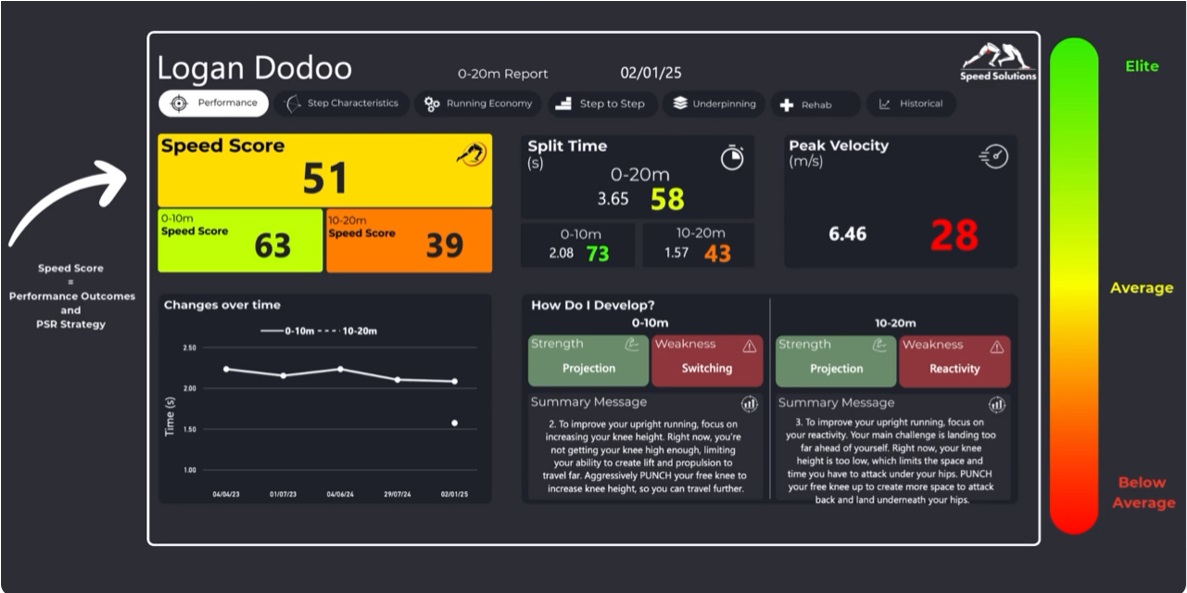
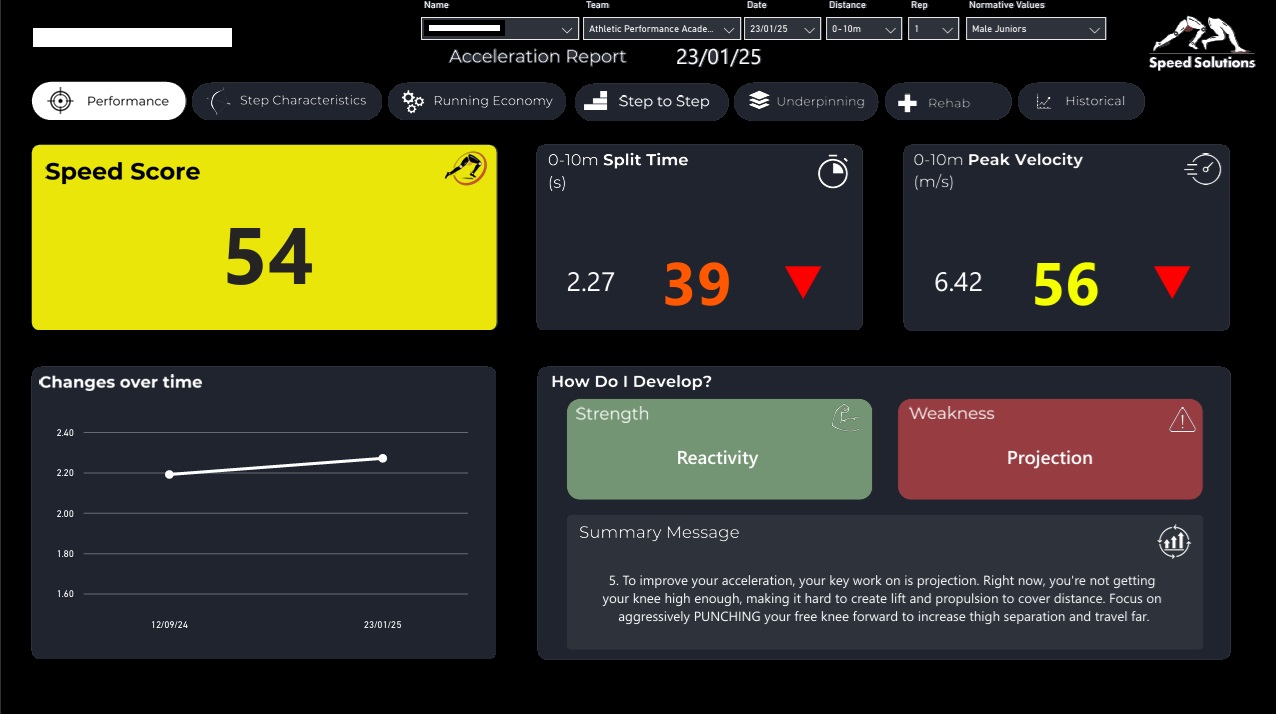
The colour coding is simple for coaches to clearly see where the athlete excels and where they need to improve.
Just like the linear speed report, GREEN is a strength and RED is a weakness. A score of 40 or less is generally RED, 50-60 is AMBER and 70 is GREEN.
These reports begin with a performance overview and include 5-0-5 times, decel and re-accel splits, the athlete’s strategy is analysed showing which stage of the run they perform well, and which stage they don’t. After this, the report concludes with a braking phase, and a turning phase breakdown, showing step velocities for each step coming in, and how well the athlete can re-accelerate out of the hole. You can listen to Jonas explain the report at the end of this section. But just a couple of clarification points for me first.
The Speed Score – there isn’t an overall speed score for the COD report currently. From personal communication with Jonas, there are just toom many factors right now to combine (acceleration, deceleration and re-acceleration). So this means, you will get a performance outcome score for the total 5-0-5 time (and a performance outcome for the 5-0 time and the 0-5 time). You’ll also get scores for their strategy (I’ll come to that later in the blog).
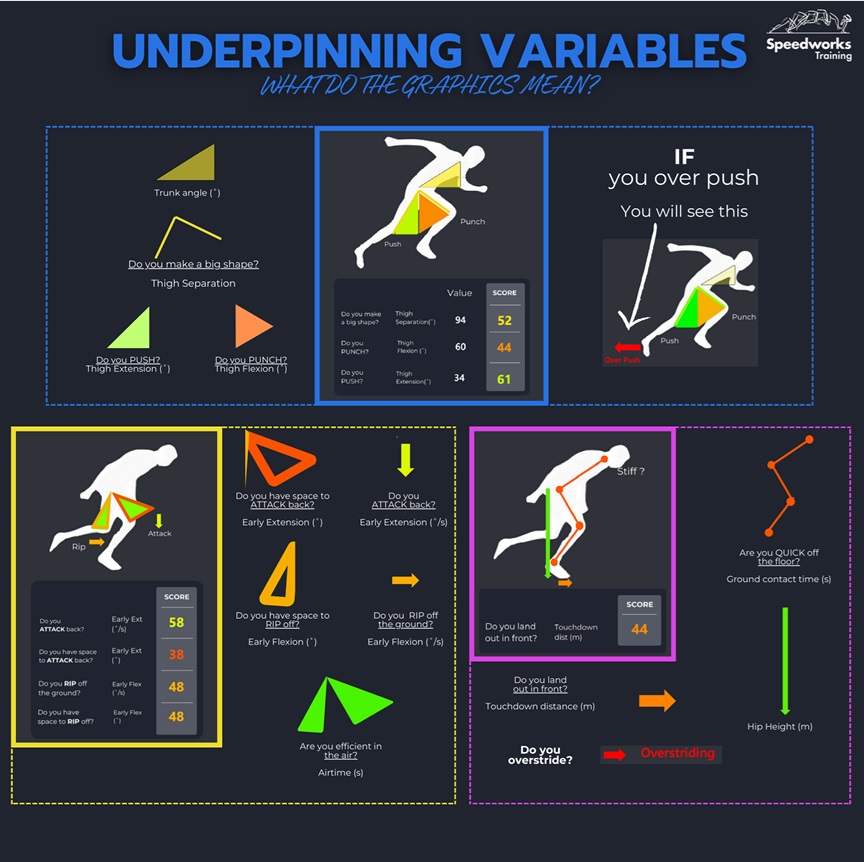
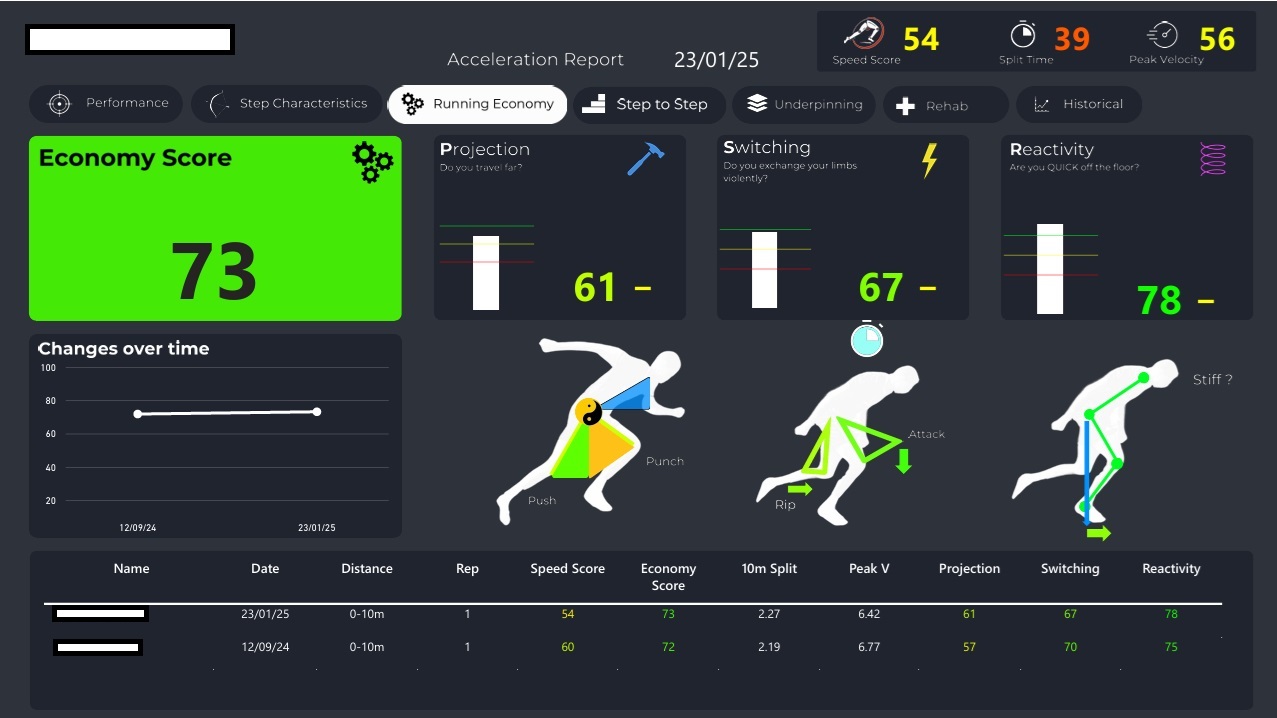
The silhouettes of the sprinters – (see the blue circled silhouette below as an example)
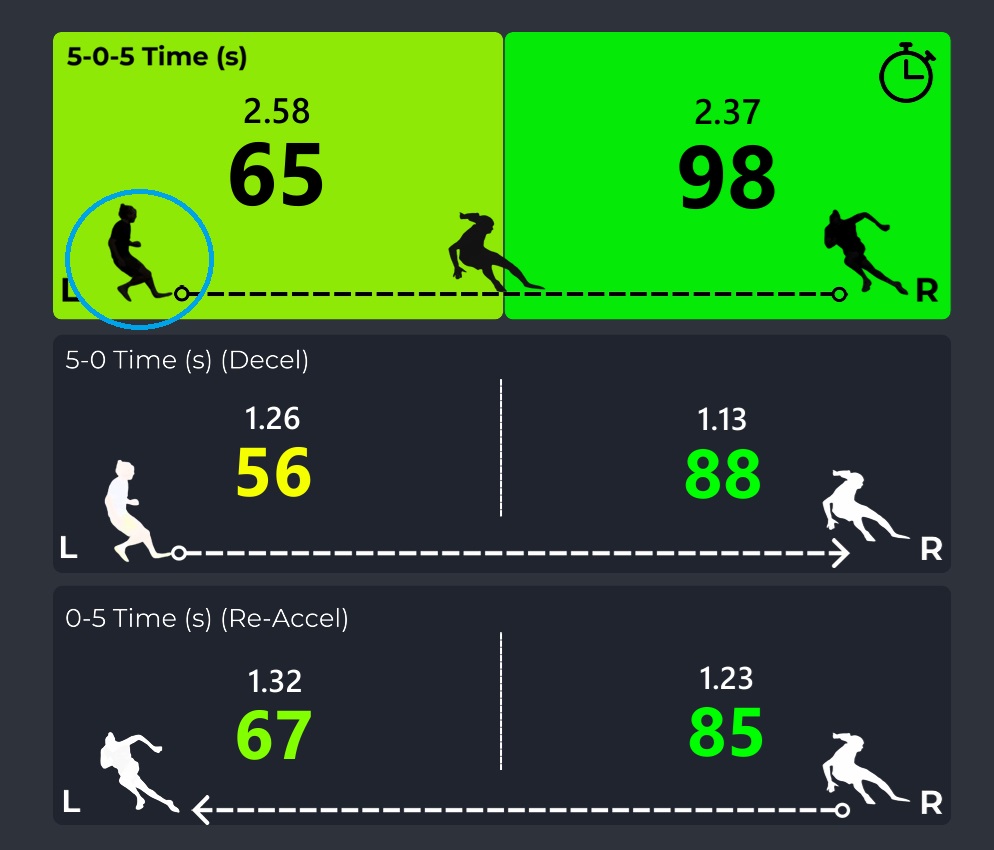
It’s just my personal opinion, but I do find these a little distracting because the shape of the silhouette doesn’t match up with the performance that is being described by the time (s) and the performance outcome score (0-100) next to it (for the COD to the right). The purpose of the silhouettes are to show that the top row is the entire phase – hence you see a silhouette of the decel, braking and re-accel phase from left to right. Just bare in mind that the example of the silhouettes are for a COD to the left.
The middle row includes a silhouette of the decel to the plant phase (again just bare in mind this is for a COD to the left). Finally, the bottom row includes a silhouette of the plant phase to the re-accel phase (again just bare in mind this is for a COD to the left).
As I personally find that a little distracting/confusing, I just tend to scan from left to right; I know that the left side all refers to the COD to the Left:
- Top row – 5-0-5 time (s) / score – e.g. 2.58 sec / 65 for a COD to the Left
- Middle row – 5-0 time (s) / score – the decel phase – e.g. 1.26 sec / 56 for a COD to the Left
- Bottom row – 0-5 time (s) / score – the re-accel phase – e.g. 1.32 sec / 67 for a COD to the Left
The numbers on the right side all refer to the COD to the right. And of course, the combination of the decel phase (1.26 sec) and re-accel phase (1.32 sec) adds up to the total 5-0-5 time of (2.58 sec) for a COD to the Left and same for the right, the combination of the decel phase (1.13 sec) and re-accel phase (1.23 sec) adds up to the total 5-0-5 time of (2.37 sec).
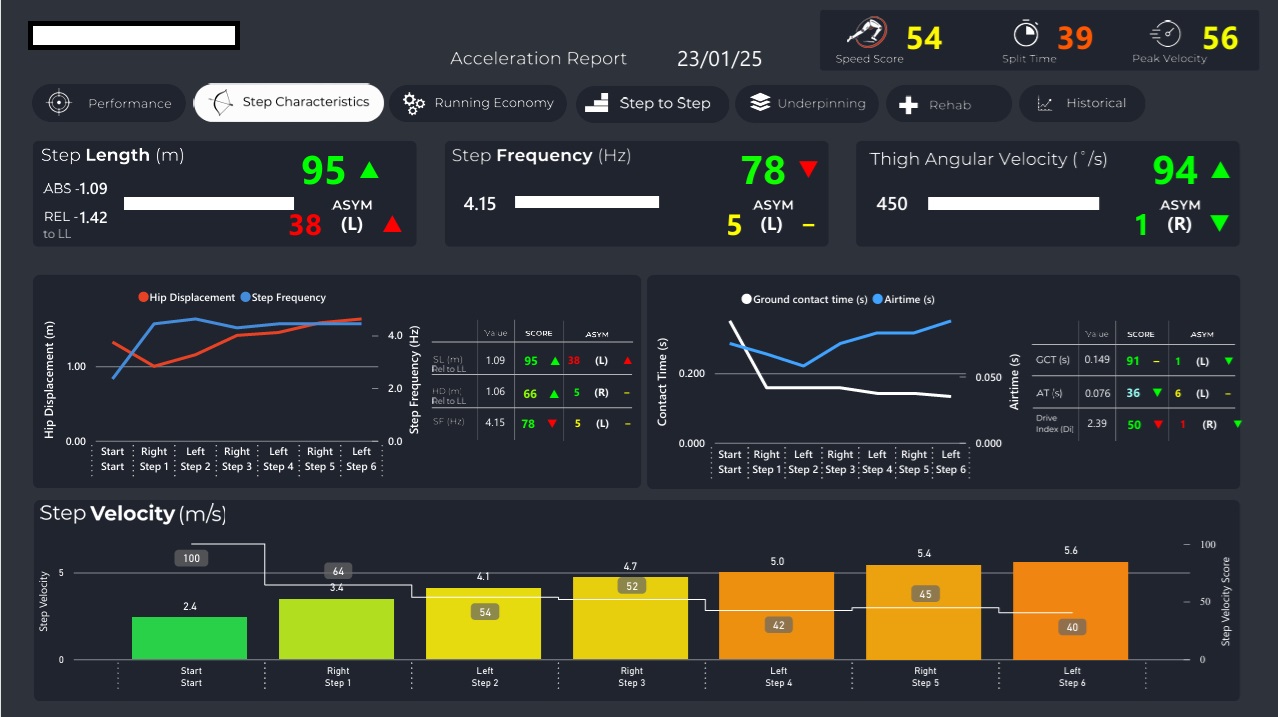
Additional performance scores – in the linear speed report they refer to peak velocity as well as total time. For COD there are a few more performance elements:
- Do you enter fast? (m/s)
- Do you brake aggressively? (m/s2)
- Time spent in the hole (s)
- Speed out of the hole (m/s)
Split times – At APA we do a 10-0-5, so the athletes enter the turn from a 10m run in. To be clear, the analysis that Speedworks does takes place from 5 metres out. I wanted to make sure the athletes were coming in with enough entry speed to ensure the COD was going to expose the athlete’s physical capabilities to turn at speed. You can decide how far away from the COD you wish to start the run in but the analysis will always be the 5-0-5. There is plenty of research out there that has researched the influence of approach distance on COD performance.
You might have seen that in the research, some researchers only count the run if the athlete comes in with 90% or more of their 10m sprint speed. We don’t do this as part of our testing, but we do instruct them to enter as fast and aggressively as they possibly can. Experience shows that a lot of our tennis athletes are happy to come in with almost the same speed as they get to on their 10m sprint!
Strategy score – In the linear speed report the focus around strategy is concerned with P, S and R. Think of your performance scores as the Outcome (effectiveness) and the strategy scores as the process (efficiency). Put another way, the strategy explains how you get the time that you do.
With the COD report the strategy is concerned with:
- Touchdown distance (m) – do you land in front?
- Trunk angle (degrees) – can you control your trunk?
- Hip height (m) – are you sitting?
Daz comment – even though Speedworks don’t refer to the above elements as P, S and R, in my own interpretation I do make the comparison. So I see it like this:
- Touchdown distance = Projection – ability to get your hips behind the direction you are applying force (displacing your hips)
- Trunk angle = Switching – ability to stabilise around the core (also needed in order to make big shapes in running)
- Hip height = Reactivity – time spent in the hole
I MUST STRESS THAT THIS IS MY INTERPRETATION AND THIS IS NOT IMPLIED BY SPEEDWORKS. For my own understanding I have chosen to make this comparison between acceleration strategy and deceleration strategy.
There are now 4 parts to the overall report – OVERVIEW– Performance – Braking phase – Turning phase
Here is a screenshot of Performance
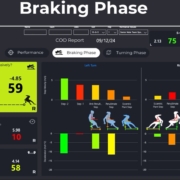
Here is a screenshot of Braking phase
Here is a screenshot of Turning phase
As practitioners that may be working in different departments such as biomechanics, strength & conditioning, medical, and coaching there is sure to be one page that peeks your interest. I personally tend to focus on the Overview and Braking phase pages.
Here is Jonas explaining the full report:
Athlete Example at APA
Let’s look an example of one of our junior athletes
10-0-5 Change of direction (Left)
10-0-5 Change of direction (Right)
His report findings
His name has been hidden for anonymity reasons. But I can say that this is a 10 year old boy and his scores are being compared to “Junior Athletes,” which for Speedworks is 13-16 year olds. Academy would be 16-18 years old.
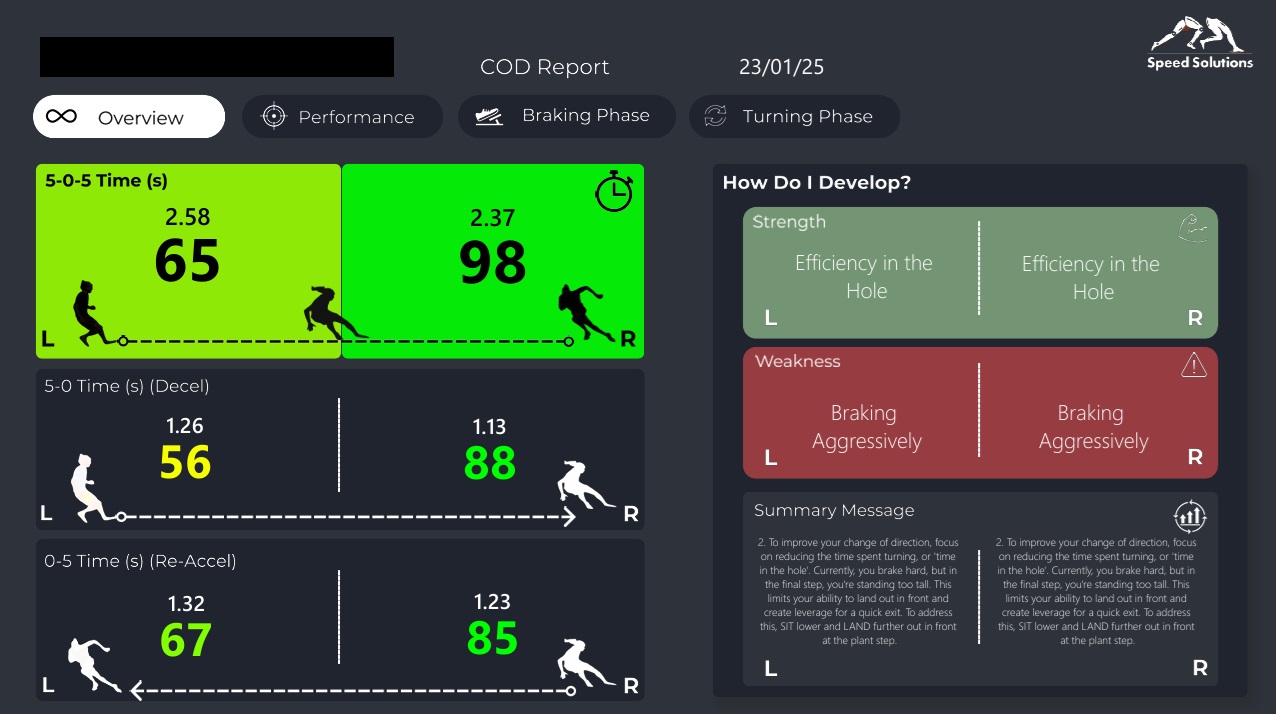
Overview
I’m working with Speedworks to help provide benchmarks for our athletes but considering he is 10 years old and is being compared to 13 year old and above boys you can see he is an exceptional athlete.
COD to the right
What this report will hopefully highlight is that his outcome in terms of 5-0-5 time to the right is Green (2.37 sec is world class!) with a score of “98.” His decel is equally good (1.13 sec) scoring “88,” and the re-accel is (1.23 sec) scoring “85.”
COD to the left
We can see that his performance to the Left is still very good, with an overall “65,” and the score is brought down a little by the fact that his decel time (1.26 sec) and re-accel time (1.32 sec) is a little longer.
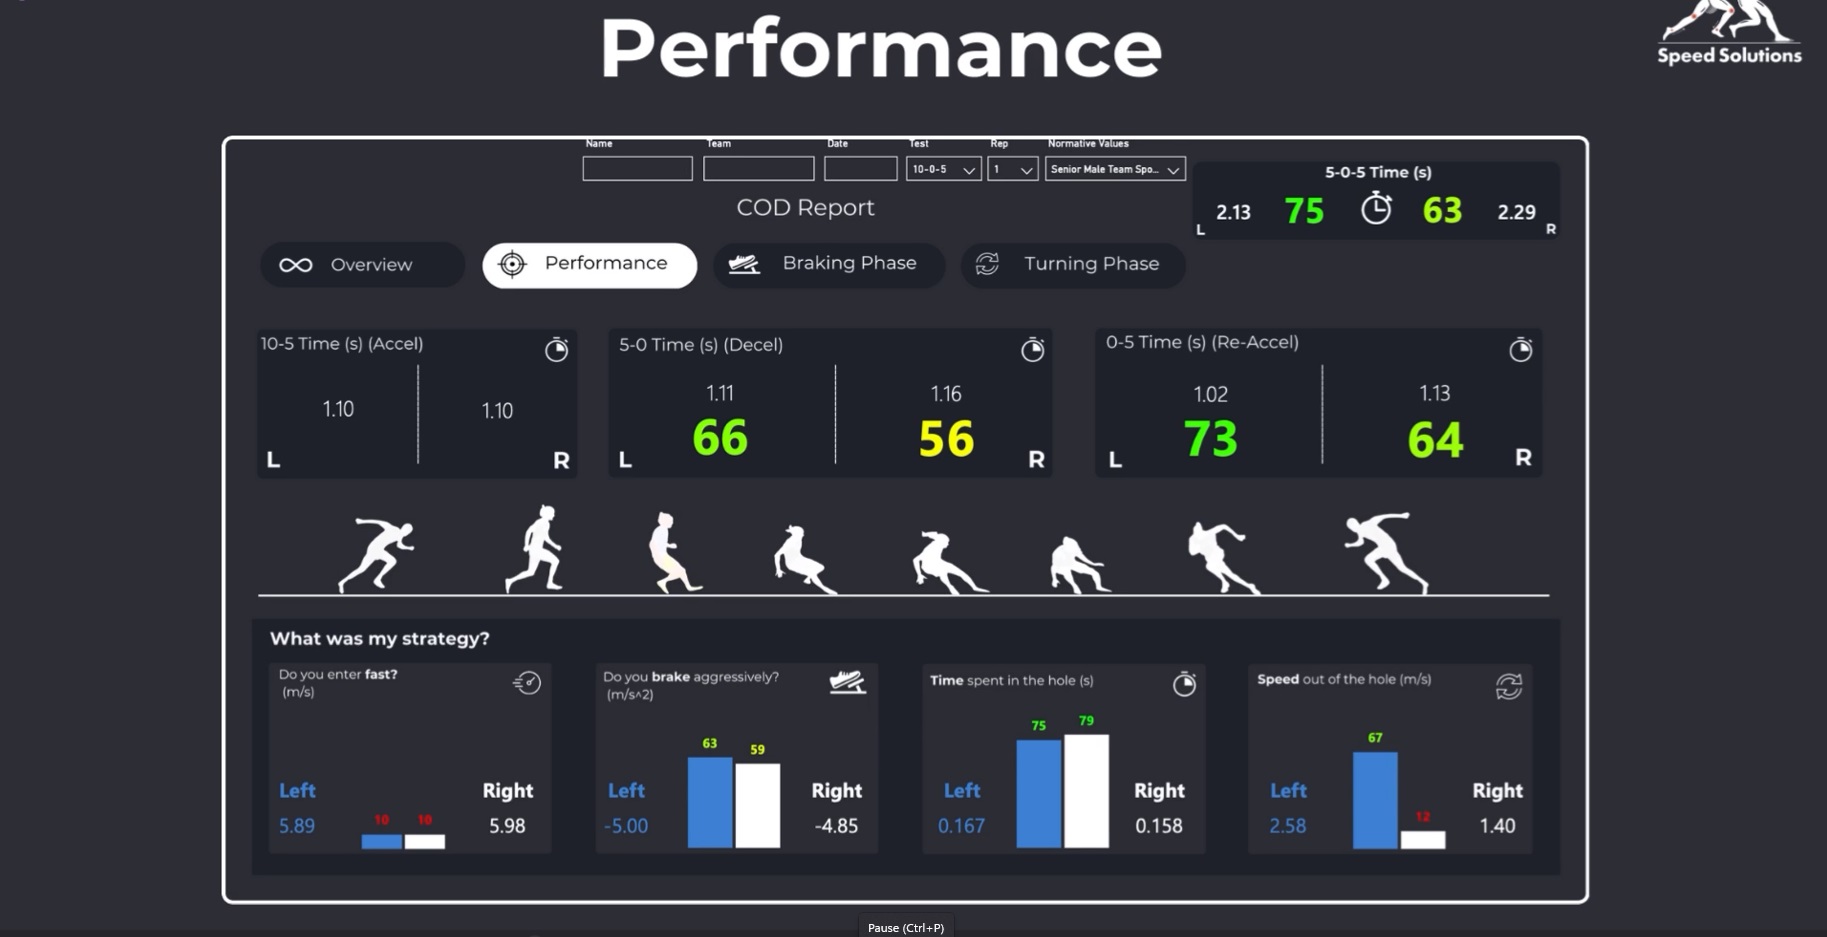
Performance
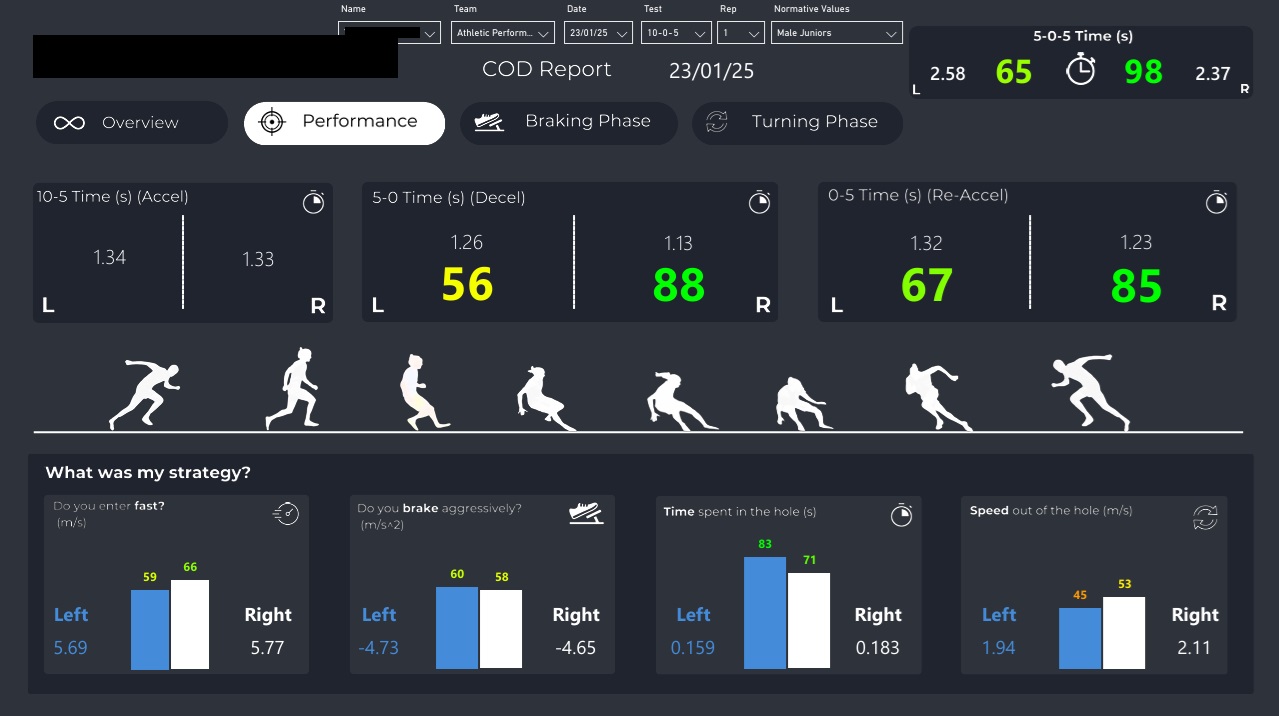
At APA one of our key performance indicators (KPIs) is the ability to decelerate hard (brake aggressively) – the deceleration potential to get up to 6 m/s2. You can see that the athlete gets up to -4.73 m/s which is a GREEN colour.
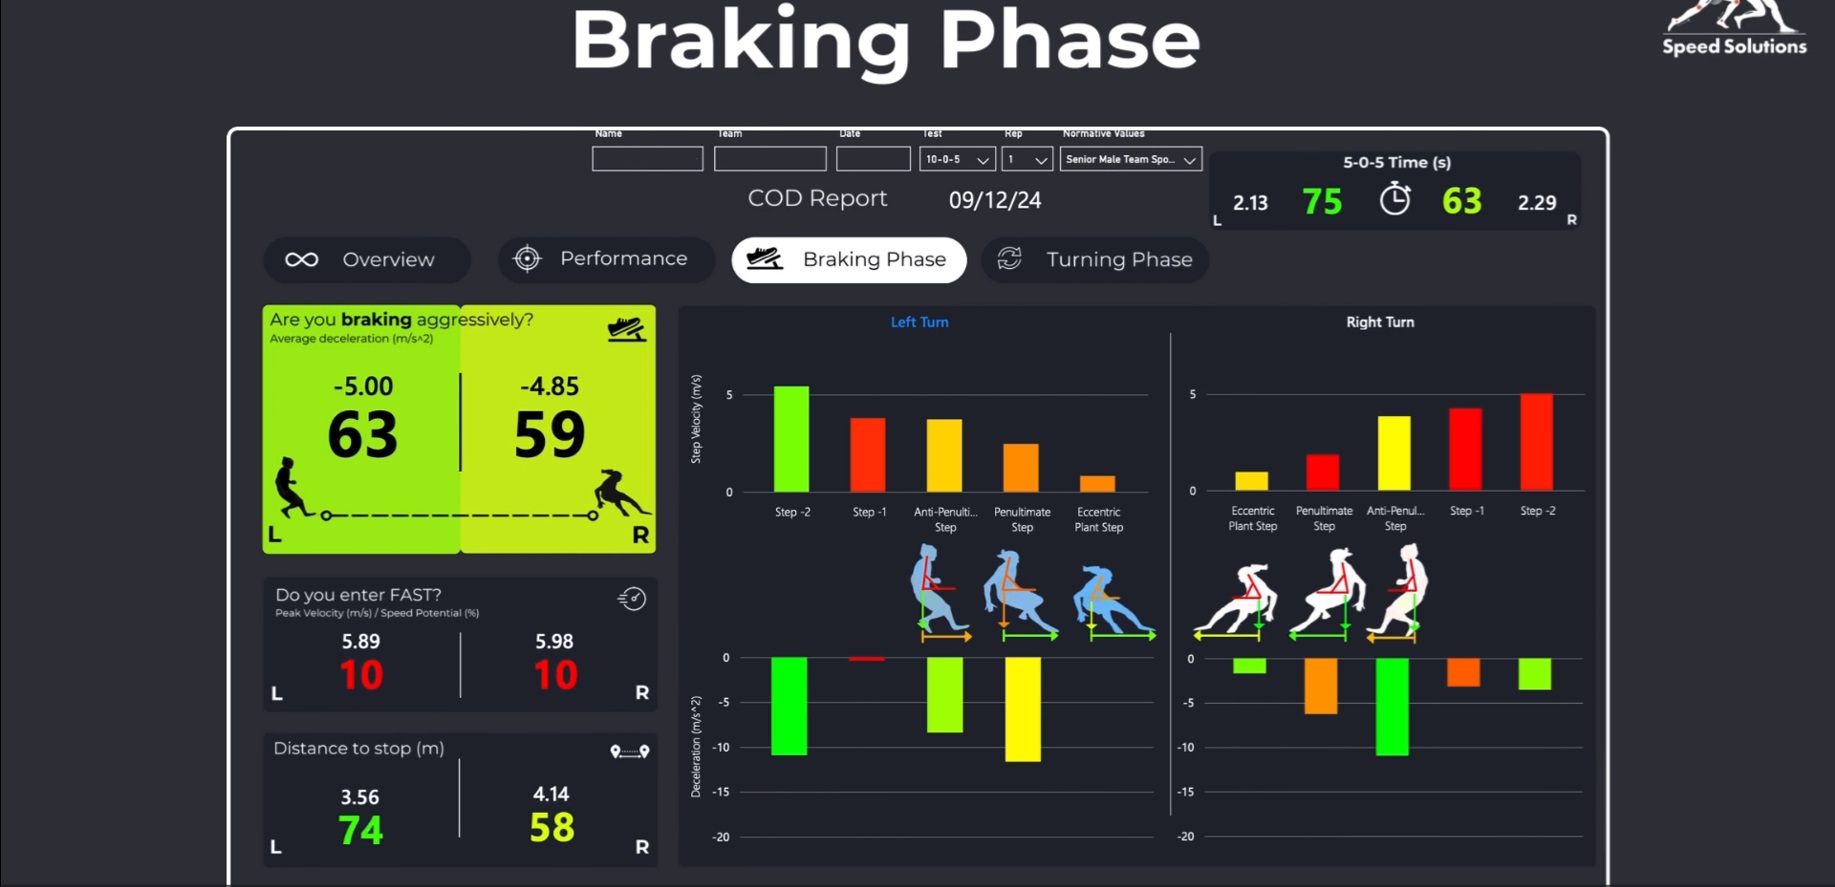
Braking Phase
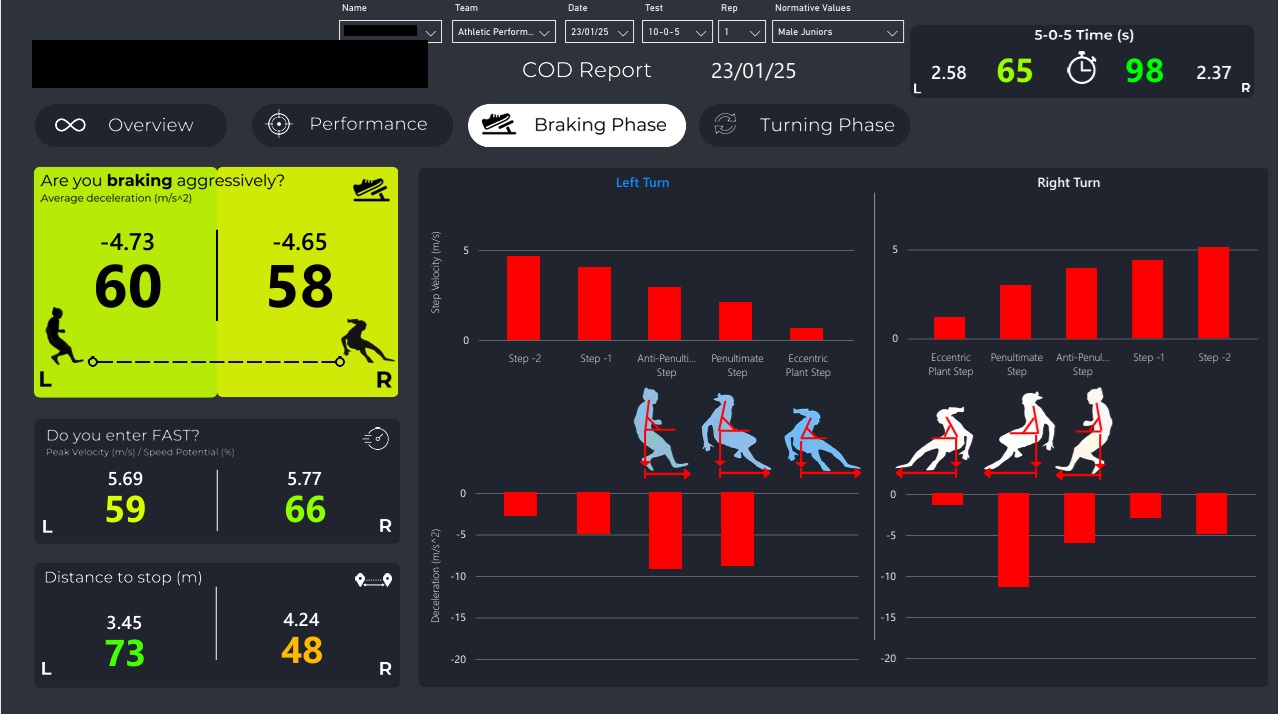
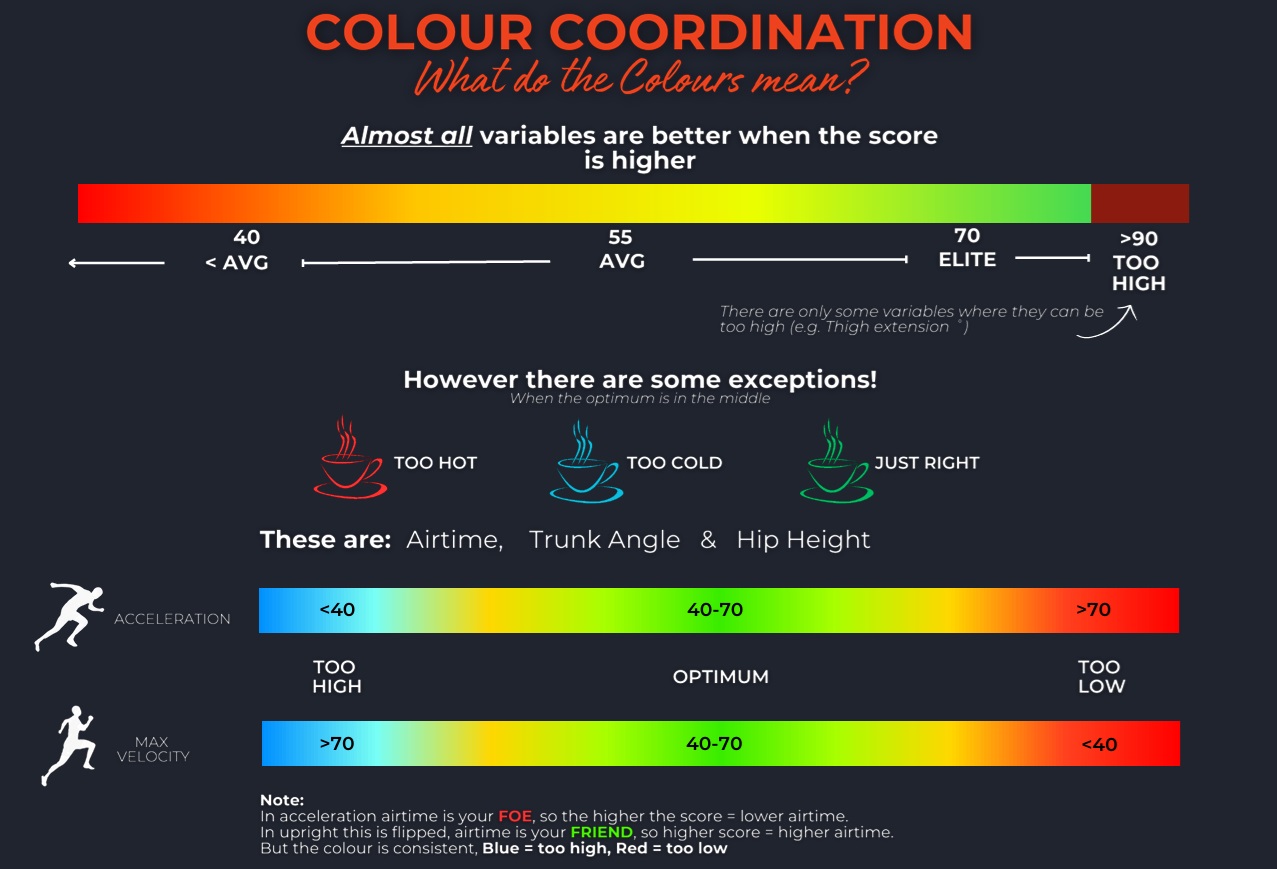
If you remember from the linear speed explanation in the previous blog, there are a few variables which are coloured BLUE if they are too high. For Deceleration these are coloured RED if they are:
- Touchdown distance – too small (they need to step further in front)
- Trunk angle – too small (they need to stay more upright)
- Hip height – too high (they need to sit lower)
The RED in the above photo shows that the athlete can be even more efficient if he touches down further in front (red horizontal arrow), lowers his trunk (red triangle on the silhouette), lowers his hips (red arrow pointing down).
You can also see that the distance to stop on the COD to the right is 4.24m compared to 3.45m on the COD to the left.
So, in comparison to the Linear speed report, the story is the opposite. If you remember, he had a low performance score for overall split time for 10m sprint but a very efficient strategy. In COD, he has a high performance score for overall COD 5-0-5 time (especially to the right) but he could still brake a lot more aggressively by improving his strategy (see above – touchdown distance, trunk angle and hip height).
My hypothesis is that as he gets stronger he may adopt a more efficient strategy. However, if he is naturally more elastic and “quick” he may typically find he is more effective with a higher more stiff approach and relies more on his tendon stiffness than muscle eccentric capacity. This is a discussion for another day – elastic vs muscle profile of the athlete!
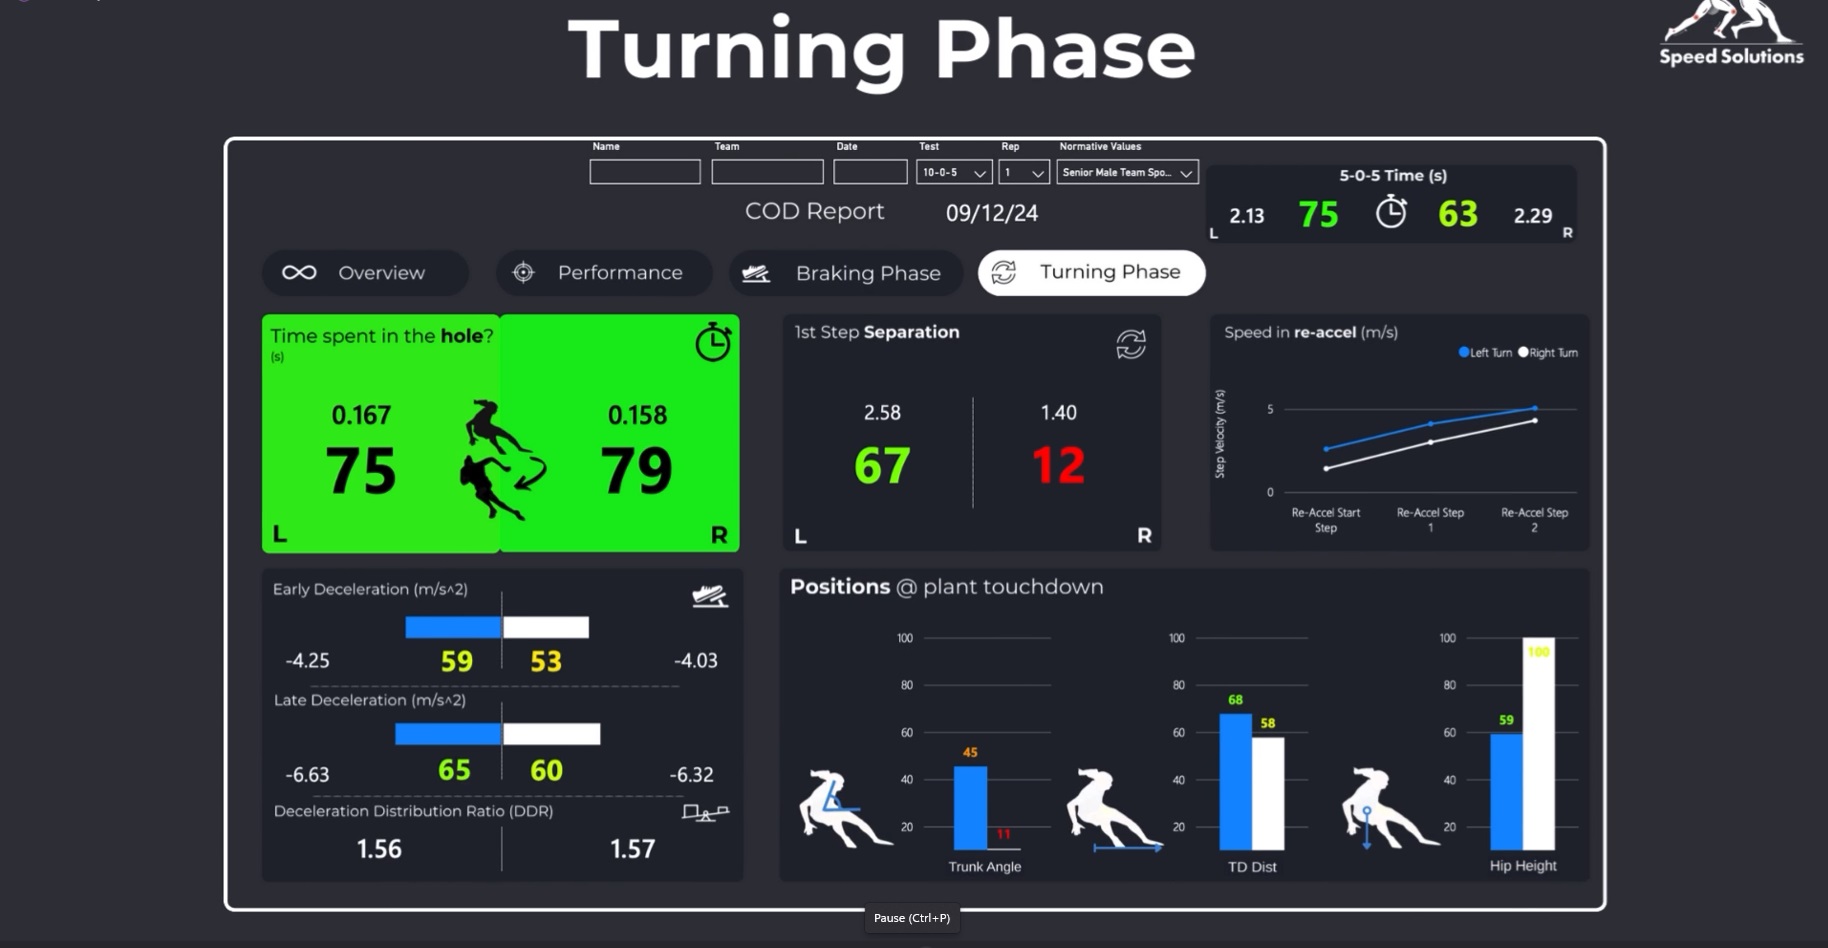
Turning phase
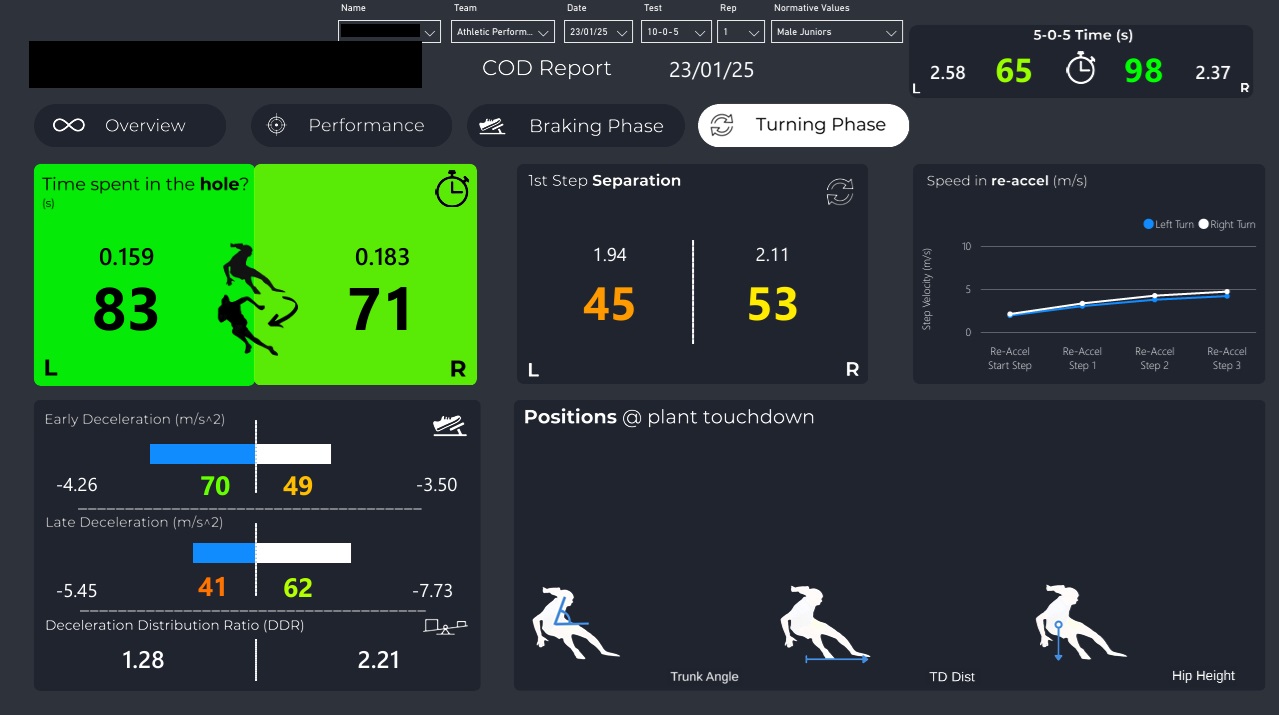
I’m not sure why there isn’t any visualisations for the Positions @ plant touchdown. As soon as I get this rectified, I’ll repost the correct version of the report. But the key thing you can see is the Deceleration Distribution Ration (DDR) – 1.28 vs 2.21. Remember, we are looking for a ratio as close to 1 as possible.
You can also see that one of the key opportunities for the young athlete to improve is their speed out of the hole.
Summary:
The reports are a terrific way for us as coaches to confirm our bias in terms of what we think we are observing in the athlete’s sprint performance. Sometimes it can be quite obvious what the areas are that need to be worked on but as you go up the ranks and start working with a group of “fast athletes” who all seem to look good at first glance, I can assure you that having this objective feedback is essential, especially if you are like me and someone who doesn’t specialise in coaching track & field on a day to day basis.
Hope you have found this article useful.
Remember:
- If you’re not subscribed yet, click here to get free email updates, so we can stay in touch.
- Share this post using the buttons on the top and bottom of the post. As one of this blog’s first readers, I’m not just hoping you’ll tell your friends about it. I’m counting on it.
- Leave a comment, telling me where you’re struggling and how I can help
Since you’re here…
…we have a small favour to ask. APA aim to bring you compelling content from the world of sports science and coaching. We are devoted to making athletes fitter, faster and stronger so they can excel in sport. Please take a moment to share the articles on social media, engage the authors with questions and comments below, and link to articles when appropriate if you have a blog or participate on forums of related topics. — APA TEAM