Athletic Performance Academy – Latest news & updates from Athletic Performance Academy

Speed, deceleration, acceleration and shot quality characteristics during Australian Open 2021-2023

Dear Reader,


I’ll admit it that the last few posts have been a bit nerdy, focusing on average data for speed, acceleration and deceleration in tennis matches, followed by the last blog looking at peak data for speed, acceleration and deceleration during popular speed and change of direction tests.  But stay with me here, as there is a good reason to go granular with the detail.


I have to thank Joey Guarascio for his insights on a Pacey Performance Podcast Episode 423, where he was discussing all things deceleration training and its application to college football.  I’m a bit shocked to see that I didn’t actually get around to featuring it in one of my 40+ PPP review blogs.  I definitely need to do that!


Anyway, he had a really neat way of laying out his philosophy where he spelt out that “our capacities are going to feed our general skills, and our general skills are going to feed our sport skills.


Capacities


  • Peak Force – impulse
  • Rate of Force Development (RFD) – time to express force
  • Stretch shortening cycle (SSC) – how elastic are you?
  • Endurance – repeatability of an action


General Skills


  • Acceleration
  • Deceleration
  • Change of Direction (COD)
  • Maximum Velocity


Joey went on to say that like a lot of coaches, he thought the team were getting a lot of high speed deceleration from their COD work, and that wasn’t the truth.  When he looked at the catapult data and looked at the highest peak deceleration, what he found was that they were not maximal when compared to a 10 Yard deceleration to a full stop.  He saw -5 to -6 ms/s on those decelerations versus in the COD drills they were around -3-5 ms/s.


“The way I look at is you want to create thresholds and you want to create RESERVES.  Just like we have a speed reserve, I also want a deceleration reserve so when they have to do -3.5 ms/s decel and they have to do it 30 times in a match that’s nothing to them as it’s only 50% of what their maximum is.”


This got me thinking immediately, and right off the bat I had a few questions:


  1. What is the peak rate of deceleration during our most demanding COD test – the m505?
  2. What is the peak rate of deceleration in a tennis match?


Well, in the last blog I  just shared with you the peak data for the m505 – see below:


The group average peak rate of deceleration was -9.78 ms/s, which typically occurred during the penultimate step (10/16 athletes).  By comparison, it was -10.28 ms/s for the males.


So let’s get to point 2.   What do we see in a tennis match?  I didn’t have anything to use a reference until I came across a journal article – Lateral End-Range Movement Profile and Shot Effectiveness During Grand Slam Tennis Match-Play (2025).


Any research paper that is based on Hawk-Eye match data taken from a Grand Slam professional tournament will always grab my attention. Sadly the data reported was “average deceleration” and “average re-acceleration,” so it didn’t quite give me a definitive comparison for “peak” accel and decel data.  It’s always a bit tricky for me to compare the kinematic data when I don’t know the ins and outs of the data analysis process.  It stated on the Data Collection selection of the paper, “peak speed was identified as the starting point in each movement cycle.  The minimum speed around the COD was identified, and the average deceleration between peak speed and minimum speed was calculated.  Furthermore, average acceleration from minimum speed to peak speed post COD was also completed.”


Just before I get to the data, it is worth pointing out that:


  • Top 10 ranked males are faster and accelerate harder during lateral end-range COD in match-play compared to those ranked > 10.
  • Top 50 ranked males are able to decelerate harder during lateral end-range COD in match-play compared to those ranked > 50.
  • Peak speed may be influenced by deceleration ability, where poorer deceleration capability results in athletes self-regulating their peak speed in anticipation of stopping or changing direction
  • The enhanced deceleration ability of better ranked players may help explain the observed differences in peak speed.


The Data


Results show that tennis athletes record average deceleration intensities of -9.0 ms/s and acceleration intensities of 9.9 ms/s during COD tasks.  [This is a lot more than the average deceleration of -4.7 ms/s I recorded for our cohort of females for the m505 and the -4.2 ms/s reported for Wimbledon main draw matches from in house data shared by LTA].  The value of -9.0 ms/s is almost as high as the peak deceleration of -9.78 ms/s recorded on the m505.


Of the limited comparable data available in the literature, elite soccer players have been shown to produce average deceleration intensities of -4.99 ms/s in testing-based environments, with a theoretical maximal acceleration of ~7.7 ms/s.  This highlights the physicality of professional tennis and underlies why COD performance is a large focus of tennis training and conditioning programmes.


My thoughts?


Well honestly I’m still a little stuck….from the data I have seen on tagged matches played using similar ball and player tracking technology at the National Tennis Centre in pro males, the range for deceleration on the tagged clipped shared was -4.7 ms/s to – 7.2 ms/s.  I’ll need to check if it is average or peak data.


The specific COD tasks that were analysed in this paper were referred to as “Lateral end range movements.”   These are thought to be some of the most physically demanding COD tasks on a tennis court.  If you want more info you can download a previous paper An application of clustering to classify movement patterns in mens professional grand slam hard court tennis which goes into more detail.


One thing I always said in my discussion with Jonas Dodoo about high powered tennis actions, is that unlike the m505, in a “running forehand” out wide we should really refer to it as a “leaping forehand” as there is a clear take off, flight and landing phase (see above).  Given the time pressure that tennis players are under to brake, plant and re-accelerate from this leap, my hypothesis is that tennis does indeed involve considerable demands on a player’s deceleration ability.


In house data from the LTA suggested that as a worse case scenario, elite players have to stop within 2 metres out wide from a running (aka leaping) forehand with an approach velocity of 6 m/s.  This is typically over a distance from the middle of the baseline to the outside tramline (5.49m) which is comparable to the 5m distance we use for the m505.


If you compare my data for the female cohort below, you will see that the best distance to stop was 2.67 m, which was given a weighting of 92/100 from the Speedworks normative data.   This athlete had a peak velocity of 5.41 m/s coming into the cut.  The average for the group was 3.77m distance to stop.


All I can say is that if elite male players are getting an average deceleration of -9.0 ms/s during Grand slam matches then goodness knows what the peak data would be?  For now, until I see more data, I’ll keep my eye on it.  If my athletes are hitting an average deceleration of -4.47 ms/s on the m505 and a peak deceleration of -9.78 ms/s, I’m confident that they are being prepared for the deceleration demands of tennis match-play (from a running point of view).  But the loads on the limbs from a leaping and landing point of view – well that’s a discussion for another day.  But let’s just say it is a violent braking manoeuvre.


Hope you have found this article useful.


Remember:

  • If you’re not subscribed yet, click here to get free email updates, so we can stay in touch.
  • Share this post using the buttons on the top and bottom of the post. As one of this blog’s first readers, I’m not just hoping you’ll tell your friends about it. I’m counting on it.
  • Leave a comment, telling me where you’re struggling and how I can help


Since you’re here…

…we have a small favour to ask.  APA aim to bring you compelling content from the world of sports science and coaching.  We are devoted to making athletes fitter, faster and stronger so they can excel in sport. Please take a moment to share the articles on social media, engage the authors with questions and comments below, and link to articles when appropriate if you have a blog or participate on forums of related topics. — APA TEAM


=> Follow us on Facebook

=> Follow us on Instagram

Deeper dives into the Speedworks PSR reports

In case you missed it


At the start of this 2025 I wrote a two part blog on the Speedworks Linear speed and COD reports.  You can read the full blog articles here and here. I wrapped up the year with some insights on the kind of kinematic data I have been able to access on tennis matchplay.


If you read my last blog, you will recall that I shared some typical “average” data for accels and decels in terms of the speeds reached and also the frequency during competitive matches.


To repeat it here – in a 2-set match we will typically see:


  • High intensity tennis movements (>2.5ms/s) – e.g., 30 accels / 17 decels
  • Very high intensity tennis movements (>3.5ms/s) – e.g., 7 accels / 11 decels
  • Total high intensity efforts (average 59 and maximum 90)
  • Max speed 6.1 m/s – but 66% of match is played at speeds below 1 m/s
  • Average speed 2.9 m/s
  • Average accel 4.0 ms/s
  • Average decel -4.2 ms/s


Now this is certainly very useful to know.  25-30 high intensity tennis movements per set.


And certainly, this enables a coach to start comparing match demands to training sessions – if you are fortunate enough to have some sort of camera ball and player tracking system (see above).


Don’t let that be an excuse though, if you can categorise the game scenarios by those that have the highest physical demand you can start to have conversations with tennis coaches to ensure you plan for a few days in the week that have a higher running demand.


I’m not interested in average


I wanted to go a stage further to know what the “peak” rates of acceleration and deceleration in tennis matches are.  It’s good to know what is going on at the “average” level but from a physical preparation standpoint I want to know what the peaks are, or “worse case scenarios.”   And I want to know how stressful moving around the court at “Gamespeed” is compared to a traditional linear sprint and a 180-degree change of direction test.


I’m making an assumption that a 10m sprint and a m505 change of direction test are appropriate key performance indicators of physical preparedness to meet the game demands.  Put another way, I’m saying that if someone is really fast on these tests, I’m more confident in their ability to handle the demands of moving around the court and certainly at a lesser (energy) cost to them.


So before I go into the match data for accels and decels I thought it was important to look at a typical 10m sprint and m505 in this blog to know what the maximum or “peak” outputs are during these tests.  At APA we work with Speedworks who provide reports to interpret the kinematic data captured on video for these tests.


10m sprint


For the 10m sprint Speedworks analyse the first six steps after the initial starting motion.  For elite sprinters they may cover the 10m with six steps but for our tennis athletes they were mostly short of 10m by the time they had carried out six steps.


In the cohort of athletes we tested I was interested to see what the peak rate of acceleration was.  This always occurs at the “start.” The Speedworks protocol has the athlete start in a staggered stance, so the start usually involves some sort of unweighting of the front foot followed by a push of it into the ground.  Step 1 is then counted as the step that hits the ground inside the 10m designated area indicated by the yellow cones between the timing gates.


As you can see, the fastest athlete who clocked 2.13 seconds for 10m also had the second highest rate of acceleration off the start at 10.1 ms/s.


The group average peak acceleration was 8.7 ms/s for the females.  By comparison, it was 9.3 ms/s for the males.  This is comparable to the 9.5 ms/s that elite sprinters are thought to accelerate at immediately out of the blocks.


I noticed that acceleration would then drop to 2-4 ms/s over those first few steps inside the yellow cones.  Please remember this last point, as this is typically what I believe other coaches are reporting when they describe the typical rates of acceleration to a ball during tennis matches (2-4 ms/s).


M505


The modified 505 (m505) consists of a 10m approach and 5m re-acceleration in the opposite direction using a 180-degree cut.  The time recorded is the time to complete the last 5m before cutting and the 5 metre re-acceleration out, 10m in total.


At APA we actually use a 10m approach distance (as technically speaking the full width of the doubles court is 10.97m).  But the protocol photo above gives you the idea.


I like to compare the 10m linear sprint to the m505 time and see the change of direction deficit score; the difference between the m505 (target 2.45sec for m505 and 1.85sec for 10m sprint females) – which would be a 0.60sec COD deficit in this example).


A good change of direction (COD) deficit score is a low one, ideally close to zero, meaning there is minimal difference between the time it takes for an athlete to run a linear sprint and the time it takes them to complete a change of direction test.


A high score indicates a greater loss of time during the turn, suggesting poor COD ability relative to linear speed.  I have found that a difference of less than 0.5 seconds is pretty good.  Our female cohort has COD deficit scores of 0.20-0.35s.  By comparison the range for the males was 0.10-0.40s).


For the m505 sprint Speedworks analyse all the steps after the initial starting motion.  The average number of steps prior to decelerating (indicated by the anti-penultimate step) was six steps, (6.44 going to the left, and 6.13 going to the right).   The range was four to nine steps prior to decelerating.  This data isn’t presented in the table below, I just took it from the raw data step-by-step parameters that I asked Speedworks for.  This is just to say that there are variations in individual strategy that result in a large range of acceleration steps prior to slowing down, with six being the average.


In the cohort of athletes we tested I was interested to see what the peak rates of acceleration and deceleration were.


As you can see, the fastest athlete who clocked 2.44 seconds for m505 also had the third highest rate of average deceleration (-5.07 ms/s).  This compared to the group average of -4.47 ms/s.   This average deceleration value is similar to what I previously reported for a tennis match (-4.2 ms/s).


The group average peak rate of deceleration was -9.78 ms/s, which typically occurred during the penultimate step (10/16 athletes).  By comparison, it was -10.28 ms/s for the males.


What was also interesting was to compare the acceleration data and re-acceleration data (as they come out of the cut).


The table above doesn’t show the acceleration data for the 10m approach.  But from analysis the highest acceleration typically occurred at the start (2.99 ms/s for females versus 3.52 ms/s for males).


In comparison, the peak rate of acceleration occurred during re-acceleration out of the cut (10.07 ms/s) during the concentric plant step in the majority of cases.


Summary of Peaks


Group average data:


10m sprint


Peak rate of acceleration: 8.7 ms/s


M505


Peak rate of acceleration: 2.99 m/s (start)


Peak rate of deceleration; -9.78 ms/s


Peak rate of reacceleration: 10.07 ms/s (concentric plant step)


One take away is that when an athlete knows they are performing a 10m sprint they seem to “get off the mark” with an initial rate of acceleration to overcome their inertia (8.7 ms/s) not unlike the rate of acceleration thought to occur immediately out of the blocks with sprinters running a 100m race (9.5 ms/s).


For some reason, on the m505 athletes don’t seem to have the same “pop” to their initial movement.  They accelerate towards the change of direction at only 2.99 ms/s (similar to what we see in terms of movement on the tennis court!).  They tend to peak in deceleration at around the penultimate step (-9.78 ms/s) and peak their acceleration during commencement of the re-acceleration out of the cut during the concentric part of the plant step (10.07 ms/s).


In the final blog on this series, I will share the peak data for tennis matches!!  Coming soon!


Hope you have found this article useful.


Remember:

  • If you’re not subscribed yet, click here to get free email updates, so we can stay in touch.
  • Share this post using the buttons on the top and bottom of the post. As one of this blog’s first readers, I’m not just hoping you’ll tell your friends about it. I’m counting on it.
  • Leave a comment, telling me where you’re struggling and how I can help


Since you’re here…

…we have a small favour to ask.  APA aim to bring you compelling content from the world of sports science and coaching.  We are devoted to making athletes fitter, faster and stronger so they can excel in sport. Please take a moment to share the articles on social media, engage the authors with questions and comments below, and link to articles when appropriate if you have a blog or participate on forums of related topics. — APA TEAM


=> Follow us on Facebook

=> Follow us on Instagram

Are Top 10 ranked tennis players better athletes than Top 100 ranked tennis players?

In case you missed it

At the start of this year I wrote a two part blog on the Speedworks Linear speed and COD reports.  You can read the full blog articles here and here


In today’s blog I felt it was time to update you on my latest reflections as it’s been a while since I last wrote a blog and as you’ll see shortly, some of the new insights I have been able to gain on our athlete’s linear speed and COD ability has been really useful in light of what I’m about to share.


For any of you who have read my blogs over the years or followed my career, you will know I’ve been involved in tennis since 2004 and throughout my career I have always been fascinated by the relationship between tennis ranking and physical fitness.  In a sport like tennis it is not as simple as equating fitter, faster, stronger with higher ranking, right?


Before I give you my latest thoughts on the matter, it will probably help with a bit of context of what good looks like in terms of acceleration and deceleration ability as I’ll come back to this later.  So I’d encourage you to read below where I explain a bit more about deceleration ability.  If you have read my previous Speedworks blog series then feel free to skip past it, and go to the section “Early 2000s.”


COD Ability

Researchers like Damian Harper have done so much to help coaches like myself visualise what is going on in deceleration during a 180 degree cut.


In the research they break the deceleration phase into EARLY vs LATE.   Basically, the point where you are no longer accelerating and increasing your velocity is known as your max velocity.  This also signifies the start of the deceleration phase.  Researchers have split the period from max velocity to lowest velocity into two phases (Vmax to 50% Vmax is EARLY phase; 50% Vmax to Vlow is LATE phase).


When researchers talk about good deceleration ability they talk about doing more of the deceleration in the “early phase.” 


The moment you choose to start decelerating we want you to slam on the brakes EARLY and HARD!  No matter how good you are at decelerating the late deceleration phase will have a higher rate of deceleration.  But we are aiming for a ratio as close to 1:1 as possible.


If you do slam on the brakes HARD you should also have an overall higher average deceleration.  From my personal experience, you want this number to be 6 m/s2 or higher.  For the S&C coaches out there we are talking about coaching interventions that will promote high rates of eccentric force absorption.


Simple enough right?


Here’s where it gets complicated.


When coaches talk about good deceleration, they talk about stopping “later” in the approach. 


So in terms of stopping distance, they want this to be smaller as this indicates you have started braking later in the run.  Can you see how the use of the words early and late could be confusing, depending on whether you are referring to the deceleration phase or the distance out from the COD?


I have told my coaches that since most athletes will not be aware of this EARLY vs LATE deceleration phase concept, focus on the words LATER, HARDER, FASTER.  Conceptually athletes can understand what you mean by stopping “later” in the 10m approach.  Our best athletes are able to slam on the brakes from 3 metres away from the turn at a speed approaching their 10m sprint speed.  See below for our elite norms.


Try to remember this average deceleration concept later. But for now, back to my reflections on Tennis.  I’ve had four moments in my career where I’ve tried to make a link being ranking and fitness.  My curiosity for what explains winning performance in tennis and the part that physical capability plays has been a big driver for my love of the sport and why I have stayed in it for so long.  For part 1 of this two part blog, I’ll describe the first three moments and I’ll save the best one for last in part 2 coming soon.


Early 2000s

During this period I was working with a few British male pro players who were invited to a pre-season winter training camp at the National Tennis Centre (NTC).  It was a rare opportunity where about a dozen athletes were split into groups according to their training needs.  What  can only be described as an approach approximating what they sometimes do in Rugby – the men were put in a fit, fast or fat group.  Now of course, these were all elite male tennis players (the majority of which were in around Top 150-400 in the world at the time) so there wasn’t really anyone who you could say was terribly out of shape, but yes essentially the fast group were the Ferraris of the group and known for being super fast by any standards you would want to use.  The fit group were known for their extraordinary endurance with Yo-yo scores all at level 20 or 21.  And the fat group, well they were considered in need of a bit of general all round development and would benefit from a little more speed and stamina than the other groups who would be in the gym a bit more doing strength work.  I should say that these were NOT the names given to the groups, and it was only for ease of explanation that the National coaches described them this way!!  I’m sure you get the idea.


The point is, during the training block the athletes did some fitness tests at the start and at the end of the block, your standard tests, 10m sprints, change of direction tests, jumps, throws, Yo-yo test etc.


The findings – there was no relationship between ranking in the fitness test and position in the professional tennis rankings – said another way; the better ranked players were not better athletes (according to the battery of general fitness tests).


2012-2014

By this time Hawk-Eye technology has been in use for several years in the Grand slam events as its official line-calling system.  If you haven’t come across it, it’s a cutting edge ball and player tracking camera technology that provides unique insight into the game demands.  The challenge for me was that the data has always been owned by the tournaments, even the players had to pay to have access to their data and it wouldn’t get to them until weeks or months later.


However, thanks to the foresight of the great sport scientists of Tennis Australia and a special shout out to Machar Reid, who has been publishing scientific articles about tennis for as long as I’ve been in tennis, Tennis Australia started analysing the Hawk-Eye data and publishing research on their findings.


In the first study that I ever came across in 2015, “Differentiating top-ranked male tennis players from lower-ranked players using hawk eye data,” I was excited to see what the findings were.


The findings – “with respect to on-court movement, top ranked players covered significantly greater distances during matches than lower ranked players.  Similarly, top-ranked players covered greater distances during receiving points than lower-ranked players.  Average speed and maximum speed did not differ between groups.


The author added that top ranked players covered greater distances during (1) entire matches and (2) points where they were receiving.  This is seemingly consistent with the counter-punching strategy, but could also indicate that top-ranked players (1) recovered to the centre court after each shot, and/or (2) took extra steps to execute strokes from more favourable positions.


Obviously, further research is necessary but these data underline the importance of movement and endurance capacities in professional men’s tennis.  In contrast, average and maximum movement speed data did not differentiate top- and lower-ranked players and – when considered alongside the stroke speed findings – presents the possibility that EXPLOSIVENESS IS NOT A CRITICAL DISCRIMINATOR OF ATP RANKING.


At the time I remember having mixed feelings about the article.  On one hand it was great to see that there was a point of difference between top ranked and lower ranked players, but on the other hand, it wasn’t what I was expecting.  You see, I’ve grown up around football and also paid attention to sports like basketball and the NBA where it has been well documented that oftentimes the best players do less work not more than the rest of the team – think Lebron James, or Lionel Messi in football.  I was okay with Machar’s hypothesis – that the best players work harder (3082 m vs. 2498m in a match) in the aspects that matter most, working harder to get in the best position possible to hit a shot, after all, isn’t that the message we champion with all the junior tennis players we work with – footwork, footwork, footwork!??


To hear that average speed of top-ranked players (1.2 m/s) was less than lower-ranked players (1.3 m/s) as well as top speed (6.1 m/s vs. 6.5 m/s); that didn’t make sense to me. If they were doing more work I thought they would also be doing it faster.  Because the stories I would hear from GPS monitoring in football (which had been using them since 2004 when I got into tennis, and on a widespread basis in football since 2015) were that lower level players usually did more work – more total distance and a higher percentage of high speed running because they were essentially chasing shadows by being constantly out of position and having to work harder to get in the right place!!  I assumed the top-ranked tennis players would have better reading of the game so would be able to cheat a few metres by having a better sense of where to position themselves because they could anticipate where the ball would be going.


So, I guess I sat on those findings and probably continued with my bias that surely top-ranked players had a physical edge on some level, and with that bias took away the idea that the best players “work harder” on recovery and adjustment steps because it probably confirmed my bias and my current understanding of the tennis world.


2019-2021

Fast forward to the Pandemic period.  If you have seen any of my socials you will have seen that I embarked on somewhat of an unofficial PhD investigating the physical determinants of elite tennis performance from 2019 to 2023.  During the pandemic period in particular, in 2020 to 2021 I went deep into the research across all aspects of the game which I split into: movement demands, serve research, groundstrokes and matchplay KPIs.  I kept going until early 2023 when I felt I could make some well researched observations that would inform my company’s coaching methods.   I’ve only posted about 40 times since April 2023 on Instagram, when I came to the end of my research and since then I have focused on “simplifying the process of physical conditioning for elite tennis,”  a process I have mainly been chipping away at but admittedly not sharing much of my brain fog on my socials in recent years.


I was clear that elite players needed to have high levels of speed, power and agility coupled with a unique endurance capacity to sustain high intensity efforts whilst making skilful shots over prolonged periods of time.  It was also clear to me that having our athletes excel in linear speed and change of direction tasks would give us more confidence that they could meet the game demands.  I had seen the emergence of acceleration and deceleration data that was coming out of other sports and some of the in-house data collected at the National Tennis Centre (NTC) from British pro men and women, and some data from Wimbledon that the performance analysis team had shared.


That data was suggesting the following for seniors vs juniors:


Junior Wimbledon (three matches QF, SF and F)

  • Average acceleration: 4.0 m/s/s
  • Average deceleration: 5.2 m/s/s
  • 66% of total below 1 m/s


Senior Wimbledon (three matches QF, SF and F)

  • Average acceleration: 4.0 m/s/s
  • Average deceleration: 4.2 m/s/s
  • 63% of total below 1 m/s


Battle of the Brits – in-house tournament organised for British players only at the NTC

  • Top 100 female data: Average distance: 7.73m / Max distance:12.62m / Max speed: 7.29 m/s /  Average speed: 2.9 m/s
  • Elite Men’s data  (2 sets plus Championship Tie breaker): Average for 23 singles matches
  • Max speed: 6.1 m/s
  • High intensity efforts (>2.5 m/s/s – 30 accels / 17 decels)
  • Very high intensity efforts (>3.5 m/s/s – 7 accels / decels 11)
  • Total high intensity efforts (average 59 – maximum 90)


In our own APA data we were seeing players getting outputs (average acceleration and deceleration) comparable to what I have just shared for Wimbledon when using our 10m and m505 change of direction test data from our speedwork reports.  So happy days.


But one thing I wanted to share was that until quite recently the tennis data I have had access to has been on either the average data for the whole match (taking into account all the shots – e.g. Wimbledon) or it has simply been quantifying the “number of efforts” above a certain threshold (2-5-3.5 m/s/s).   But what is the higher rate of average acceleration and deceleration on the toughest shots you can make in tennis, and do the top ranked players have higher or lower rates of acceleration and deceleration?


Fast forward to the present day and we have Machar Reid and his team to thank for once again publishing some data from the Australian Open.  I’ll save this insight for the next blog.  What do you think we will find out?


Hope you have found this article useful.


Remember:

  • If you’re not subscribed yet, click here to get free email updates, so we can stay in touch.
  • Share this post using the buttons on the top and bottom of the post. As one of this blog’s first readers, I’m not just hoping you’ll tell your friends about it. I’m counting on it.
  • Leave a comment, telling me where you’re struggling and how I can help


Since you’re here…

…we have a small favour to ask.  APA aim to bring you compelling content from the world of sports science and coaching.  We are devoted to making athletes fitter, faster and stronger so they can excel in sport. Please take a moment to share the articles on social media, engage the authors with questions and comments below, and link to articles when appropriate if you have a blog or participate on forums of related topics. — APA TEAM


=> Follow us on Facebook

=> Follow us on Instagram

APA are Recruiting!

APA Are Recruiting!


If you would like to be considered for a role with APA then please send a covering letter and CV to APA Owner, Daz Drake at daz@apacoaching.co.uk with email title APA.01

Bromley Tennis Centre


Head of Strength and Conditioning Bromley Tennis Centre

Job Title: Head of Strength and Conditioning
Reports to: Head of Tennis Performance/ APA Director
Responsible for: Assistant S&C Coach x2, Physio team
Location: Bromley Tennis Centre, Avebury Road, Orpington
Employment Terms: This is a full time self-employed term time position 39 weeks of the year with option to do part-time hours (3 days a week) during holidays.
Salary: In region of £30,000 subject to fulfilment of a monthly invoice for agreed hours.


Bromley Tennis Centre

Bromley Tennis Centre is one of only three venues in Britain which has attained both Local and Regional Player Development Centre status. It is funded by the LTA to develop the best talent at under 14 level and is home to a number of the country’s best junior players. Their athletic performance program provides a route to the National Academy as part of the LTA performance pathway. Bromley has 6 permanent indoor courts and a further 4 which are covered with a bubble in winter and are outdoors in summer. There is also a fully equipped strength and conditioning gym and fitness suite as well as on-site physio team. As well as a prominent performance programme, Bromley is a community indoor tennis centre home to around 1200 social and development players each week. Bromley Tennis Centre is also an LTA Coach Development Centre offering coach education opportunities to coaches across the country. It is a requirement for all staff to follow safeguarding policies and evidence a commitment to the safety and welfare of children.


Job Overview

Support the Bromley Tennis Academy Head of Performance and the multidisciplinary team to develop and implement a world class player development program to produce an oversupply of players who upon departing Bromley Tennis Centre meet the National Academy selection Criteria.


Lead the delivery of strength and conditioning support to RPDC players and coordinate with the multidisciplinary team to maximise the physical preparedness of academy players.


Main Roles and Responsibilities

● Build on and develop the APA strength and conditioning philosophy and curriculum that is intertwined with the academy’s strategy.
● Work closely with the coaching staff and wider support team in an interdisciplinary fashion to help enhance athletic performance.
● Oversee and manage the entire strength and conditioning offering at Bromley Tennis Centre and line manage the strength and conditioning team.
● Flexibly plan, programme and coach strength and conditioning sessions to Academy players, which is underpinned by sound scientific evidence and practice-based rationale.
● Help mentor the assistant strength and conditioning coaches and intern coaches within the academy regarding technical and non-technical skill development.
● Track athlete progress to inform future training direction.
● Provide impactful feedback to coaches, players and parents to help drive behaviour change, including three times a year Fitness test reporting.
● Be the S&C point of contact for all LTA National Camps/Assessments


Essential Criteria

● Significant experience practising as a strength and conditioning coach in a performance environment.
● Significant experience analysing the demands of sports and implementing a strength and conditioning strategy to support performance goals.
● Experience developing junior athletes.
● Significant experience of working as part of a team in an interdisciplinary fashion.
● Significant record of continuous professional development.
● Knowledge and understanding of health & safety and safeguarding.


Desirable criteria for this role to include:

● Previous experience of development of an LTAD pathway in a youth sport organisation
● A full understanding of international standards in both senior and Junior tennis
● Proven experience of managing members of staff


Skills and Abilities

● Highly effective at delivering impactful strength and conditioning programmes that are underpinned and guided by science.
● Clear understanding of other support services and their role within the interdisciplinary team.
● Ability to prioritise time and workloads effectively to optimise impact individually and as part of a team.
● Role model professional behaviours and ability to develop the skills of junior practitioners.
● High levels of emotional intelligence
●Highly effective at fostering professional relationships with relevant parties to promote idea sharing and collaboration.


Qualifications

● UKSCA Accreditation or ability to obtain it within 6 months
● Qualification at degree level or equivalent in Sports Science or related area specialising in the area of physical preparation of elite athletes
● First Aid and Enhanced DBS
● Willingness to undertake LTA safeguarding course

So what are you waiting for?


If you are interested in applying for this role then send an email to APA Owner, Daz Drake at daz@apacoaching.co.uk

Closing date: 24th March 2025


Interviews will be held Wednesday 2nd April 2025 at Bromley Tennis Centre. If you are successful at interview, you will be required to start work April 21st, 2025, subject to a DBS. 

Free Training Reminder

If you have signed up for the FREE Webinar ”How To Get Buy In That Lifting Weights Is Safe For Children” then click the link below to sign up!

SIGN UP HERE

Hope you have found this article useful.

How to Analyse Your Athlete’s Speed – Part 2

In case you missed it


In part one of this two-part blog series I went through Speedwork’s Linear speed report.  You can read the blog article here.


In today’s blog I’ll be looking at the COD report.  This is a more recent addition to Speedwork’s analysis and it’s something I have been really excited to see ever since I knew they were going to offer this service to compliment the linear speed report.

COD Report

Speedworks have become known for their ability to simplify the process of coaching linear speed using their PSR system.  It should come as no surprise that over time, some of their clients in team sports started to ask about deceleration ability.  It has certainly become a hot topic in recent years.  So when we talk about deceleration and COD, in comparison to linear speed, it is probably an even easier sell to coaches and tennis players on the value of being able to perform a 180 degree COD effectively and efficiently.  


I must admit, I’ve been studying a lot of the COD research over recent years and must give credit to the likes of Damian Harper, Thomas Dos Santos and Dr Sophia Nimphius.  I’m pointing this out just to say that it has definitely helped me to digest some of the concepts in the report feedback that follows.  So, if it feels a little confusing you can always reach out to me and I’ll try my best to help!


In the linear report I cut straight to the report.  For the COD report I feel it would be better to set the scene with a brief overview of some key concepts related to COD performance.  As I said, researchers like Damian have done so much to help coaches like myself visualise what is going on in deceleration during a 180 degree cut.


In the research they break the deceleration phase into EARLY vs LATE.   Basically, the point where you are no longer accelerating and increasing your velocity is known as your max velocity.  This also signifies the start of the deceleration phase.  Researchers have split the period from max velocity to lowest velocity into two phases (Vmax to 50% Vmax is EARLY phase; 50% Vmax to Vlow is LATE phase).


When researchers talk about good deceleration ability they talk about doing more of the deceleration in the “early phase.” 


The moment you choose to start decelerating we want you to slam on the brakes EARLY and HARD!  No matter how good you are at decelerating the late deceleration phase will have a higher rate of deceleration.  But we are aiming for a ratio as close to 1:1 as possible.


If you do slam on the brakes HARD you should also have an overall higher average deceleration.  From my personal experience, you want this number to be 6 m/s2 or higher.  For the S&C coaches out there we are talking about coaching interventions that will promote high rates of eccentric force absorption.


Simple enough right?


Here’s where it gets complicated.


When coaches talk about good deceleration, they talk about stopping “later” in the approach. 


So in terms of stopping distance, they want this to be smaller as this indicates you have started braking later in the run.  Can you see how the use of the words early and late could be confusing, depending on whether you are referring to the deceleration phase or the distance out from the COD?


I have told my coaches that since most athletes will not be aware of this EARLY vs LATE deceleration phase concept, focus on the words LATER, HARDER, FASTER.  Conceptually athletes can understand what you mean by stopping “later” in the 10m approach.  Our best athletes are able to slam on the brakes from 3 metres away from the turn at a speed approaching their 10m sprint speed.  See below for our elite norms.


Male 10-0-5 <2.35sec Female 10-0-5 <2.45sec
3m distance to stop from 5.76m/s
Aim for Touchdown distance >0.5 standing height


So let’s take a look at the latest COD Speed report released by Speedworks in 2025 (V5)


The colour coding is simple for coaches to clearly see where the athlete excels and where they need to improve.


Just like the linear speed report, GREEN is a strength and RED is a weakness.  A score of 40 or less is generally RED, 50-60 is AMBER and 70 is GREEN.


These reports begin with a performance overview and include 5-0-5 times, decel and re-accel splits, the athlete’s strategy is analysed showing which stage of the run they perform well, and which stage they don’t.  After this, the report concludes with a braking phase, and a turning phase breakdown, showing step velocities for each step coming in, and how well the athlete can re-accelerate out of the hole.  You can listen to Jonas explain the report at the end of this section.  But just a couple of clarification points for me first.


The Speed Score – there isn’t an overall speed score for the COD report currently.  From personal communication with Jonas, there are just toom many factors right now to combine (acceleration, deceleration and re-acceleration).  So this means, you will get a performance outcome score for the total 5-0-5 time (and a performance outcome for the 5-0 time and the 0-5 time).  You’ll also get scores for their strategy (I’ll come to that later in the blog).


The silhouettes of the sprinters – (see the blue circled silhouette below as an example)


It’s just my personal opinion, but I do find these a little distracting because the shape of the silhouette doesn’t match up with the performance that is being described by the time (s) and the performance outcome score (0-100) next to it (for the COD to the right).  The purpose of the silhouettes are to show that the top row is the entire phase – hence you see a silhouette of the decel, braking and re-accel phase from left to right.  Just bare in mind that the example of the silhouettes are for a COD to the left.


The middle row includes a silhouette of the decel to the plant phase (again just bare in mind this is for a COD to the left).  Finally, the bottom row includes a silhouette of the plant phase to the re-accel phase (again just bare in mind this is for a COD to the left).


As I personally find that a little distracting/confusing, I just tend to scan from left to right; I know that the left side all refers to the COD to the Left:


  • Top row – 5-0-5 time (s) / score – e.g. 2.58 sec / 65 for a COD to the Left
  • Middle row – 5-0 time (s) / score – the decel phase – e.g. 1.26 sec / 56 for a COD to the Left
  • Bottom row – 0-5 time (s) / score – the re-accel phase – e.g. 1.32 sec / 67 for a COD to the Left


The numbers on the right side all refer to the COD to the right.  And of course, the combination of the decel phase (1.26 sec) and re-accel phase (1.32 sec) adds up to the total 5-0-5 time of (2.58 sec) for a COD to the Left and same for the right,  the combination of the decel phase (1.13 sec) and re-accel phase (1.23 sec) adds up to the total 5-0-5 time of (2.37 sec).


Additional performance scores – in the linear speed report they refer to peak velocity as well as total time.  For COD there are a few more performance elements:


  • Do you enter fast? (m/s)
  • Do you brake aggressively? (m/s2)
  • Time spent in the hole (s)
  • Speed out of the hole (m/s)


Split times – At APA we do a 10-0-5, so the athletes enter the turn from a 10m run in.  To be clear, the analysis that Speedworks does takes place from 5 metres out.  I wanted to make sure the athletes were coming in with enough entry speed to ensure the COD was going to expose the athlete’s physical capabilities to turn at speed.  You can decide how far away from the COD you wish to start the run in but the analysis will always be the 5-0-5.  There is plenty of research out there that has researched the influence of approach distance on COD performance.


You might have seen that in the research, some researchers only count the run if the athlete comes in with 90% or more of their 10m sprint speed.  We don’t do this as part of our testing, but we do instruct them to enter as fast and aggressively as they possibly can.  Experience shows that a lot of our tennis athletes are happy to come in with almost the same speed as they get to on their 10m sprint!


Strategy score – In the linear speed report the focus around strategy is concerned with P, S and R.  Think of your performance scores as the Outcome (effectiveness) and the strategy scores as the process (efficiency).  Put another way, the strategy explains how you get the time that you do.


With the COD report the strategy is concerned with:


  • Touchdown distance (m) – do you land in front?
  • Trunk angle (degrees) – can you control your trunk?
  • Hip height (m) – are you sitting?


Daz comment – even though Speedworks don’t refer to the above elements as P, S and R, in my own interpretation I do make the comparison.  So I see it like this:


  • Touchdown distance = Projection – ability to get your hips behind the direction you are applying force (displacing your hips)
  • Trunk angle = Switching – ability to stabilise around the core (also needed in order to make big shapes in running)
  • Hip height = Reactivity – time spent in the hole


I MUST STRESS THAT THIS IS MY INTERPRETATION AND THIS IS NOT IMPLIED BY SPEEDWORKS.  For my own understanding I have chosen to make this comparison between acceleration strategy and deceleration strategy.


There are now 4 parts to the overall report – OVERVIEW– Performance – Braking phase – Turning phase


Here is a screenshot of Performance


Here is a screenshot of Braking phase


Here is a screenshot of Turning phase


As practitioners that may be working in different departments such as biomechanics, strength & conditioning, medical, and coaching there is sure to be one page that peeks your interest.  I personally tend to focus on the Overview and Braking phase pages.


Here is Jonas explaining the full report:


Athlete Example at APA


Let’s look an example of one of our junior athletes


10-0-5 Change of direction (Left)


10-0-5 Change of direction (Right)


His report findings

His name has been hidden for anonymity reasons.  But I can say that this is a 10 year old boy and his scores are being compared to “Junior Athletes,” which for Speedworks is 13-16 year olds.  Academy would be 16-18 years old.


Overview

I’m working with Speedworks to help provide benchmarks for our athletes but considering he is 10 years old and is being compared to 13 year old and above boys you can see he is an exceptional athlete.


COD to the right

What this report will hopefully highlight is that his outcome in terms of 5-0-5 time to the right is Green (2.37 sec is world class!) with a score of “98.”  His decel is equally good (1.13 sec) scoring “88,” and the re-accel is (1.23 sec) scoring “85.”


COD to the left

We can see that his performance to the Left is still very good, with an overall “65,” and the score is brought down a little by the fact that his decel time (1.26 sec)  and re-accel time (1.32 sec) is a little longer.


Performance


At APA one of our key performance indicators (KPIs) is the ability to decelerate hard (brake aggressively) – the deceleration potential to get up to 6 m/s2.  You can see that the athlete gets up to -4.73 m/s which is a GREEN colour.


Braking Phase


If you remember from the linear speed explanation in the previous blog, there are a few variables which are coloured BLUE if they are too high.  For Deceleration these are coloured RED if they are:


  • Touchdown distance – too small (they need to step further in front)
  • Trunk angle – too small (they need to stay more upright)
  • Hip height – too high (they need to sit lower)


The RED in the above photo shows that the athlete can be even more efficient if he touches down further in front (red horizontal arrow), lowers his trunk (red triangle on the silhouette), lowers his hips (red arrow pointing down).


You can also see that the distance to stop on the COD to the right is 4.24m compared to 3.45m on the COD to the left.


So, in comparison to the Linear speed report, the story is the opposite.  If you remember, he had a low performance score for overall split time for 10m sprint but a very efficient strategy.  In COD, he has a high performance score for overall COD 5-0-5 time (especially to the right) but he could still brake a lot more aggressively by improving his strategy (see above – touchdown distance, trunk angle and hip height).


My hypothesis is that as he gets stronger he may adopt a more efficient strategy.  However, if he is naturally more elastic and “quick” he may typically find he is more effective with a higher more stiff approach and relies more on his tendon stiffness than muscle eccentric capacity.  This is a discussion for another day – elastic vs muscle profile of the athlete!


Turning phase


I’m not sure why there isn’t any visualisations for the Positions @ plant touchdown.  As soon as I get this rectified, I’ll repost the correct version of the report.  But the key thing you can see is the Deceleration Distribution Ration (DDR) – 1.28 vs 2.21.  Remember, we are looking for a ratio as close to 1 as possible.


You can also see that one of the key opportunities for the young athlete to improve is their speed out of the hole.

Summary:

The reports are a terrific way for us as coaches to confirm our bias in terms of what we think we are observing in the athlete’s sprint performance.  Sometimes it can be quite obvious what the areas are that need to be worked on but as you go up the ranks and start working with a group of “fast athletes” who all seem to look good at first glance, I can assure you that having this objective feedback is essential, especially if you are like me and someone who doesn’t specialise in coaching track & field on a day to day basis.


Hope you have found this article useful.


Remember:

  • If you’re not subscribed yet, click here to get free email updates, so we can stay in touch.
  • Share this post using the buttons on the top and bottom of the post. As one of this blog’s first readers, I’m not just hoping you’ll tell your friends about it. I’m counting on it.
  • Leave a comment, telling me where you’re struggling and how I can help


Since you’re here…

…we have a small favour to ask.  APA aim to bring you compelling content from the world of sports science and coaching.  We are devoted to making athletes fitter, faster and stronger so they can excel in sport. Please take a moment to share the articles on social media, engage the authors with questions and comments below, and link to articles when appropriate if you have a blog or participate on forums of related topics. — APA TEAM


=> Follow us on Facebook

=> Follow us on Instagram

How to Analyse Your Athlete’s Speed

Back when coaches like me had to buy DVDs  to learn the latest cutting edge speed drills I remember watching with excitement in 2003 as I devoured DVD series such as those from Martin Rooney and Bill Parisi of Parisi speed school (see below).

2003

Parisi begins to build a national brand with results from the NFL Combine and other world-class athletes. The company also starts its 10-part DVD series that focuses on improving athletes’ game speed.  (I have all 10!)


As helpful as they were at giving me a real toolbox of speed drills, there was limited consideration for how to analyse someone’s speed technique beyond a basic observation checklist using the acronym  – R.U.N. G.R.E.A.T


R – rhythm

U – unnecessary movements or asymmetry

N – neural type (explosive or not)


G – ground reaction force (reactive or not)

R – leg recovery

E – eccentric control (do they stay stiff or not)

A – arm action

T – timing


I still remember that acronym to this day!  But as much as I liked it, this didn’t quite go far enough for me to give my athletes objective feedback on what they were doing well and what they needed to do better in order to sprint faster and/or move more efficiently.  Fast forward 20 years and in 2023 I made the decision to partner with Speedworks, a Loughborough based coaching company specialising in sprinting and headed up by renown coach Jonas Dodoo.


You can here more about Jonas and Speedworks here and here


Through Jonas’ early experience as a coach under the mentorship of Dan Pfaff he quickly understood the importance of observation skills when watching your athletes move/sprint.  And so coaching eye was something that was really hammered down very early for Jonas. And by accident, he realized that coaching eye was something that everyone wanted to learn from him.


I first learnt about Jonas’ attempts to quantify sprint performance objectively with his launch of the Binary app during the Pandemic.  Jonas said at the time:

“My expectations are probably based on my bias. This is what I think good movement looks like and fast speed looks like. And I think over the past five years I’ve been able to take a step back from my bias or at least combine my bias with reality, with real data, with real numbers and actually maybe close the line between what I perceived them to be able to do and what they actually do. A long winded way of describing it.”


When APA came onboard, Jonas had already upgraded and found a new partner in Vuemotion so now what happens is APA submit the video of the 10m sprint and 10-0-5 COD to Vuemotion who use AI to analyse the kinematic features of the runs and then Speedworks interprets the data with their own algorithm and set of KPIs based on Jonas’ years of experience.  What comes out the other end is a report.


Linear Speed Report

At APA I made the decision that even though we work in tennis where you rarely accelerate for more than a few steps, it is important for our athletes to learn to sprint properly.  So when we talk about acceleration, we’ve got to be careful that we’re not setting a goal for a 10 metre time and encouraging a technique and a strategy that gets us there fast, but puts us in a bad position.


I want balanced athletes that have a robust running technique allowing for individual style (same as we say about their tennis technique) and puts them in an efficient position.  For tennis this is mostly about learning to be an efficient mover per se and I can’t think of anything better than sprinting to develop your ability to work at 100% effort without wasting unnecessary energy.  For other sports it might be about putting you in the optimum position at 10m to make a decision, such as in team sports. And you also need to be an efficient position to keep getting faster in a linear sport. 


APA have used timing gates for years and it certainly helps to give objective data on the time of the run but it doesn’t tell you anything about the strategy used to achieve that time.


So let’s take a look at the latest Linear Speed report released by Speedworks in 2025 (V5)


These reports display key information including key performance outputs and overall speed score, followed by step characteristics and the athlete’s PSR score.  You can listen to Jonas explain the report at the end of this section.  But just a couple of clarification points for me first.


  1. The Speed Score – is a composite of Performance outcome (meaning split time and peak velocity) AND process aka strategy (PSR scores).  You might be expecting that the goal is to get 100 in everything.  In fact, as we are looking for an optimum running technique we find that a more balanced spread of ability across the factors is preferred, so a Speed Score of “70” is actually optimum.  It is colour coded so RED is typically below 40, yellow is around 50-60 and GREEN is typically 70 and above.
  2. Split times – At APA we only do a 10m sprint but you can see that if you submit a 20m sprint Speedworks will break down the run into a 0-10m and a 10-20m analyse.


The colour coding is simple for coaches to clearly see where the athlete excels and where they need to improve.


There are now 7 parts to the overall report – PERFORMANCE – Step characteristics – Running Economy – Step to Step – Underpinning – Rehab – Historical


Here is a screenshot of Running Economy


Here is a screenshot of Step to Step


As practitioners that may be working in different departments such as biomechanics, strength & conditioning, medical, and coaching there is sure to be one page that peeks your interest.  I personally tend to focus on the Performance and Running economy pages.


One thing I’ll add below is a guide that Speedworks have sent me to help understand the different aspects of the athlete’s PSR strategy in more detail.  Remember, Green is Good.  The more closer to Red the more this is a weakness.


Here is Jonas explaining the full report:


Athlete Example at APA

Let’s look an example of one of our junior athletes


I’ve chosen this athlete because he is one of the only athletes I have videoed (and we have now videoed over 50 athletes) who has some of the characteristics of running technique that we might hope to see in an athlete who has a technique that will allow them to keep getting faster beyond 10m.


From experience, most of our tennis athletes are PROJECTION dominant, meaning they displace their hips really well but this ends up looking like overstriding so they don’t have a good leg recovery and as a result their SWITCHING and REACTIVITY is compromised.


Sprint performance is all about combinations. And neither is it about maximizing your stride length, neither it is about maximizing your stride frequency. It’s about finding this optimal because of the fact that our limbs don’t work in isolation, energy transfers through our pelvis to each limb. So it’s not about getting the most out of the pushing leg and getting a massive toe off distance and making a massive shape because if you do that, what you may end up doing is not having any pretension in your swing leg that’s in front. 


And this is typically what we see in tennis players because they want to make a massive shape to reach for the wide ball as this ensures they have the best chance of making contact with the ball even if they are on the full stretch.  Contact point with the ball is a non negotiable.  This means they will often times negotiate on other things such as pretension, as the objective isn’t to keep getting faster beyond 10m in most cases.


His report findings

His name has been hidden for anonymity reasons.  But I can say that this is a 10 year old boy and his scores are being compared to “Junior Athletes,” which for Speedworks is 13-16 year olds.  Academy would be 16-18 years old.


I’m working with Speedworks to help provide benchmarks for our athletes but considering he is 10 years old and is being compared to 13 year old and above boys you can see he is an exceptional athlete.  What this report will hopefully highlight is that his outcome in terms of Split time might be “39” indicated by the colour Orange/red but his strategy (Economy score) of how he achieves that time is optimal  “73” indicated by the colour Green.


This tells me that as he gets bigger and stronger and catches up the older boys in terms of limb length he will surely be one of our fastest athletes as well in terms of split time, provided he continues to optimise his step characteristics through growth and maturation.  No pressure team!


Performance 


Step characteristics


At APA one of our key performance indicators (KPIs) is the ability to get up to “Game speed” as quickly as possible – the acceleration potential to get up to 6 m/s by the third step (Step 3).  You can see that the athlete gets up to 4.7 m/s which is a YELLOW/Orange colour, indicating that as he goes through the 10m run step velocity performance relative to the junior benchmark is going down a little bit with each step.


Running Economy


This is an example of what we mean at APA by a “balanced” athlete.  I don’t mean that in the literal sense of being able to keep his balance.  I mean that he has a optimal blend of PROJECTION – SWITCHING – REACTIVITY.


If you remember earlier, there are a few variables which are coloured BLUE if they are too high.  For Acceleration these are:

  • Air time
  • Trunk angle
  • Hip height


The blue in the above photo shows that the athlete can be even more efficient if he lowers his trunk (blue triangle on left hand side), and lowers his hips (blue arrow pointing down on the right hand side).  If you check back to the Step Characteristics photo, you will see that Air Time is scored “36” so we want lower air time at the start so he can spend more time pushing the floor away.


Summary:

The reports are a terrific way for us as coaches to confirm our bias in terms of what we think we are observing in the athlete’s sprint performance.  Sometimes it can be quite obvious what the areas are that need to be worked on but as you go up the ranks and start working with a group of “fast athletes” who all seem to look good at first glance, I can assure you that having this objective feedback is essential, especially if you are like me and someone who doesn’t specialise in coaching track & field on a day to day basis.


In the next blog I will take you through the COD report!


Hope you have found this article useful.


Remember:

  • If you’re not subscribed yet, click here to get free email updates, so we can stay in touch.
  • Share this post using the buttons on the top and bottom of the post. As one of this blog’s first readers, I’m not just hoping you’ll tell your friends about it. I’m counting on it.
  • Leave a comment, telling me where you’re struggling and how I can help

Since you’re here…

…we have a small favour to ask.  APA aim to bring you compelling content from the world of sports science and coaching.  We are devoted to making athletes fitter, faster and stronger so they can excel in sport. Please take a moment to share the articles on social media, engage the authors with questions and comments below, and link to articles when appropriate if you have a blog or participate on forums of related topics. — APA TEAM


=> Follow us on Facebook

=> Follow us on Instagram


Not all Jumps are created Equal

Dear coach,


I wanted to update you on a couple of recent developments in the APA Method.  I periodically revisit the APA Homepage and the “About APA” section – which you can read here to hold myself accountable to the vision I have for the company.  As part of the 2025 Vision to be the Best Tennis S&C team in the World it has been my personal mission to evolve the Strength, Power and Speed methods to ensure our athletes are getting the best possible service, what I call APA 2.0.  Today I’d like to discuss some of my recent thoughts on lower body power methods.   If APA 1.0 is our High Performance Training Method, then APA 2.0 is the fine tuning that enables us to squeeze the juice out of our most elite performers using highly targeted assessment and training means.


Lower Body Power – Bounding & Skill Mill

  • 3 Hop as an assessment of single leg force capacity and ability to key positions important for deceleration and general movement
  • Relevance of bounding as a more representative task that closely approximates the reciprocal nature of limbs in running
  • Use of non motorised treadmill to assess Absolute Peak Power Output (PPO) in locomotive task to compliment vertical jump assessment of PPO


In today’s blog I would like to update on progress on 3 Hop and Bounding, with a bit of a review on why are think they are important test, how we are using them and how they link to our use of the Speedworks P, S, R system.


If you haven’t got time to read the full article now, be sure that you can find out all about the topics discussed in this blog (and more!) at my next “Speed & Agility for Tennis” Coach Development day hosted by speedworks in December.


Anyway, back to the blog!


Introduction

The stretch-shortening cycle (SSC) is a natural variation of muscle function found in conventional human movements.  In sports, one common modality to improve SSC performance is through plyometric training.  The countermovement jump (CMJ), squat jump (SJ), drop jump (DJ), hopping and bounding are the most commonly used movements to assess SSC exercise performance and lower limb power.


YET…….. when training or assessing individuals, exercise selection is CRITICAL as movement SPECIFICITY may influence the degree of the relationship and transference into performance.


Now, before you think this is going to be another debate about training specificity just hear me out!  Regardless of the exercise choice, sprint performance relies on strength, power and stiffness of the leg muscles and also higher levels of reactive strength.  It’s why I decided to partner with speedworks, as I truly believe that sprinting is the ultimate movement screening tool!  I also believe that single leg plyometrics are more specific to the movement demands of tennis and sprinting in general.


Matthew McInnes Watson of PlusPlyos aka “The Plyo Guy” put me onto this idea of looking at momentum being one of the main things that we want to monitor in our plyometrics.  Verkoshansky’s fundamental theory of plyometrics pointed out straight away that you need initial momentum, and you need an airborne phase to initiate truly plyometric elastic capabilities within an athlete.  When we are looking at incoming momentum and how that affects outgoing momentum we are able to understand a larger picture of reactive strength/elastic strength.


In terms of overall specificity we need to look at specificity from a broader perspective.  In order to understand an exercise’s level of specificity, we need to take account of:


  • ADAPTATION specificity – muscle motor unit recruitment (force), tendon stiffness, CSA etc
  • ATHLETE specificity – age, gender, stage of development, Athlete type – more force or elastic driven?
  • SPORT specificity – common actions within the sport – more acceleration or max speed, in terms of jumping: more 2 leg take off and landing, 2 to 1, 1 to 1, more sagital plane, transverse/frontal plane, more horizontal or vertical etc?


In terms of specificity to tennis the large exertion of propulsive force during acceleration is more relevant.  Check out this excellent introduction from Cyril Genevois below:


A few key points:

  • More than 70% of movements in elite tennis are lateral
  • 80% of movement is less than 2.5m, less than 5% is more than 4.5m
  • You don’t have time in tennis to reach high velocities so the most important thing in tennis is to be able to accelerate and decelerate
  • Evolution of the movement pattern of the split step: landing with two feet simultaneously is out of date!
  • Now, elite players react in the air during the split and land on the foot furthest from their intended direction


So what?


The split step is not the same as it was 30 years ago.  We need to react on a single leg, so you need what we call “single leg reactive strength” to move on this first step by reacting on the outside foot (the “start” phase).


This means that on the split step there is greater activity for ankle extensor muscles of the outside leg compared to the other one before landing to better use the stretch-shortening cycle during the first lateral movement.


Then it is a matter of lower body explosive strength to produce some force on the first two steps (the “move” phase).  Note that this is where I’m thinking the “bounding” exercise fits in the “move” phase.  It teaches cyclical expression of explosive strength; it teaches you to move!  Then to stop it’s eccentric strength.  Then when you hit the ball it’s a combination of strong stabilisation and upper and lower body power (the “hit” phase).  Then in change of direction it’s single leg reactive strength and finally re-acceleration you need explosive strength (the “recover” phase).  All of these phases involve cyclical action of the lower extremities with an emphasise on unilateral repetitive movement.


One final side point on the above “Footwork Cycle.”  It’s easy to understand it as START – MOVE – HIT – RECOVER when you imagine that every ball we move to we can stop behind and hit the ball while being stationary.  In reality most of the shots that a tennis player hits “on the move” require deceleration of the legs AFTER contact with the ball, so after the hit.  That’s why I put the 3 hop & stick as part of the APA plyometric series for “braking strength” within the hit part of the footwork cycle.  It’s where the highest braking forces will typically be; after hitting a wide ball on the move, where you decelerate after contact.


Below is an example of the 3 hop & stick:


Check out Roger Federer below doing what is known as the hit and shuffle (or hit & cross over if the legs cross), more commonly known as the “mogul” move.  As he transfers his weight onto his left foot after he hits the ball he uses it somewhat like the “penultimate step” of a braking step in a 180 degree cutting action.


So getting back to the “move” phase, in terms of power exercises and plyometrics in particular, what are the PHYSICAL exercises we can do to improve the [tennis] movement to the ball?  I have come more and more to the realisation that just as sprinting (and acceleration in particular) requires the need to generate great propulsive horizontal forces with a short contact time, so too do we need to think about this in our jump programme.  Today I’ll look at a more linear orientated plyometric activity that we are using to prepare our tennis players for the demands of full court coverage when hitting on the run.  I’ll look at some of the more frontal plane orientated plyometrics in another post, which will speak to the split step and recovery actions which rely on lateral hip strength.


Specificity of bounding to sprinting


Compared to other forms of exercise, bounding and hopping can provide specificity for sprinting due to their ability to generate great propulsive horizontal forces with a short contact time, which is important for production of high levels of power.  Furthermore, bounding emphasises the rectus femoris muscles during the forward leg swing which is critical for producing forward accelerative forces.  Also, this exercise is performed unilaterally and respectively, replicating actual sprinting movements.


As with all exercises, you can do them in different ways, with different intentions, in order to achieve different outcomes.   Now the speed coaches would argue that true bounding is specific to the late acceleration phase of sprinting.  In my opinion, if you do what I call “long bounds” over distances of 20-30m for 2-3 sets I’m going to introduce that early in the general preparation period because I want to focus on submaximal effort (think extensive method in terms of intensity) with the goal of learning how to maximize the number of take-offs without increasing the magnitude of voluntary force efforts (keep it relaxed and bouncy!).  Later on in the preparation period I can do what I call “short bounds” over distances of 10-20m performed at maximal effort (think intensive method) with the goal of maximizing the power output of leg propulsion movements, without increasing the ground contact time.  We have come up with the 4-fold leap test as a tool to measure your maximal effort elastic capabilities – more on this test later!


I can hear the tennis coaches saying, well if tennis players only need to be really good at accelerating over the first two steps, how relevant is bounding to tennis, if it is going to enhance acceleration over 10-30m?


But remember, I’m not trying to chase sport specificity necessarily.  The whole reason I decided to introduce bounding into the APA Plyometric framework was because I saw the utility of it to address athlete specificity.  You can have athletes who are more force driven or more elastic driven, right?  I would call this more projection focused or switching focused.  From my experience of profiling multiple tennis players using the speedworks PSR framework of Projection, Switching and Reactivity, I’ve seen a trend for tennis players to be projection dominant but poor in switching.  This means they are very good at displacing their centre of mass forward and so will probably be good at the projection aspect of the bound but don’t make big shapes and really attack the ground beneath them from above.


The bound also has an “air time” component and I see the bound as a great tool to invite players to be more elastic and specifically use that air time to improve their switching ability.  To make a big shape, which is what switching is all about, the bound will allow you more time in the air; you will have a swing through (in the air), some time to think about what you’re doing to do with your foot and then you’re going to put it down.  This will enable you to attack down from above and round out your overall athletic profile by giving you a greater level of switching capability.


My thought process:  Length & Air – projection dominant – pullers – fast SSC – good at ATTACKING – Links to Bounding


Key point: if you can agree with me, that rounding out an athlete’s overall speed profile to be more proficient across all aspects of sprinting efficiency is important for long term development and robustness, then you will agree that you can’t do this by only replicating the movements that they already do all the time in their sport, and probably for that reason are more dominant in?


For tennis I’m in favour of a “power bound” more commonly known as a bound-for-distance, as it’s more relevant to early acceleration.  In a typical 10 bound series, a distance achieved of 20m or less would be considered sprinting, and a distance of 27m would be considered a bound for distance, with speed bounding being somewhere in the middle.  To promote the power bound at APA we measure distance as the KPI and cue to “bound as far as possible.”  As a test, we would measure distance achieved over 4 bounds.  The distance-focus task will alter the mechanics of the foot landing, where heel makes contact first with the ground (ie., this technique can be called “stepping”), thus promoting higher braking impulses, instead of using the ball of the foot as in speed-bounding.  But, it’s for this reason that I prefer the power bound, because tennis players do move across the court using a heel-toe action.


Here are a few videos so you can see the difference between a speed bound and a power bound:


In the video below you can see one of our interns performing three bounds over 10m.  The coach happens to be an elite sprinter and this was a submaximal effort for him as I asked him to go easy, given he was wearing running shoes on an indoor tennis court.  But it gives you an idea.


I’m in favour of the power bound as I feel it’s very strongly related to the jump such as the squat jump indicating the need for explosive power in the hips (think projection of your body forward).  I also think that the typical stride length and pattern which you might say would promote “over striding” if the goal was to prepare for a proper leg recovery at top speed, is more close to how elite tennis players cover the width of the baseline when they are hitting on the run!


We are also trialling something I’m calling the 4-fold leap test, again you can see what it looks like below.  There is more focus on gaining distance so you don’t get such a noticeable attacking of the knee down so you can really rip the leg forward.


Obviously with the tennis leap, the focus is on horizontal projection, keeping your hips and centre of mass closer to the ground, whereas on the 4-fold leap test you are getting a more aggressive vertical displacement seen in the higher knee drive.  The main benefit is that the leap promotes the heel to toe weight transfer and teaches the feeling of taking bigger more powerful steps.


If you wanted to perform a more “tennis specific leap” you would just limit the running steps to two before you then initiate a leap on the outside leg and land on the inside leg, which would definitely make more sense to do in the later preparation phase where you are overloading the actual high-powered tennis action of the “running forehand.”  But as I said before, the benefit of doing repeated bounds is you get that repetition of the feeling of the heel to toe weight transfer and the opportunity to make bigger shapes and improve switching capability.


One final thing to point out is that the way an athlete will approach the task will give you a great insight into how they like to produce power – are they more force dominant or are they more velocity dominant?  It’s a bit like watching someone perform a counter movement jump – the “contact time” dominant athletes who are very “reactive” will only take a small dip before exploding up, and get off the floor quickly.  Compare this to the “jump height” dominant athletes who are very strong and will take a lot more of a dip to maximise their muscle strength.  This allows them more time in contact with the ground to generate a higher velocity at take off and so ultimately a higher jump height, albeit at the cost of a longer jump phase.  These same athletes might be called “projection” dominant using the speedworks training system nomenclature.


You see the same expression of power seen in the 4-leap test, where those athletes who rely on more muscle strength will yield more at the ankle, knee and hip versus the more reactive athletes who won’t.  So there is lots of versality in how you modify the distance and time constraints to invite the athlete to solve the problem using different movement strategies to develop the qualities you want to improve in them.  I see the power bound as an important tool in the tennis S&C coaches’ toolbox.


Enjoy the full clip of Djokovic in full flow – the running forehand shot is around the 12 second mark of the video


Hope you have found this article useful.


If you have made it to the end, then be sure that you can find out all about the topics discussed in this blog (and more!) at my next “Speed & Agility for Tennis” Coach Development day hosted by speedworks in December.


Date: Saturday 14th December 2024

Time: 11:00-15:30pm

Location: Loughborough University


Remember:

  • If you’re not subscribed yet, click here to get free email updates, so we can stay in touch.
  • Share this post using the buttons on the top and bottom of the post. As one of this blog’s first readers, I’m not just hoping you’ll tell your friends about it. I’m counting on it.
  • Leave a comment, telling me where you’re struggling and how I can help


Since you’re here…

…we have a small favour to ask.  APA aim to bring you compelling content from the world of sports science and coaching.  We are devoted to making athletes fitter, faster and stronger so they can excel in sport. Please take a moment to share the articles on social media, engage the authors with questions and comments below, and link to articles when appropriate if you have a blog or participate on forums of related topics. — APA TEAM


=> Follow us on Facebook

=> Follow us on Instagram

=> Follow us on Twitter

Pacey Performance Podcast Review – Episode 503

Episode 503 – Fearghal Kerin – “Managing T-junction injuries and location based hamstring rehab”

Fearghal Kerin


Background

In this episode of the Pacey Performance Podcast, Fearghal Kerin, Rehabilitation Physiotherapist, Chelsea Football Club, discusses the growing prevalence of T-junction hamstring injuries and the importance of location-specific rehabilitation strategies.


Hamstring injuries are classified into sprint-type and stretch-type, with the T-junction—a confluence of the long and short head of the biceps femoris—being particularly susceptible to injury. This area is complex due to its dual force vectors, dual nerve supply, and bi-articular function, making it challenging to rehabilitate.


🔉 Listen to the full episode here


For a  comprehensive overview you might also like to read:


Discussion topics:


“What’s behind the interest in hamstrings.  Was it a personal interest? Was it the PhD that sucked you in?  Did you manipulate that to fit what you wanted to look at the area you wanted to go down?”


“I’ve had a long time relationship with a professor at University College Dublin, someone who I collaborated with for some time and he came to me 2016-17 with a potential source of funding if we could figure out if I wanted to carry out a PhD, and Leinster Rugby have been amazing for a load of us guys who came through who were all able to complete a PhD through our time at Leinster.  So the question was, what would that actually look like?  I considered all body parts and initially my thought was let’s go down the concussion route.  It is so important for where that sport is going, and if we can make a difference in that area and contribution, it would seem like a very worthy thing to do.  But also at the time, like everybody who works in sport, there is the eternal challenge of hamstring injuries in the background and challenges you professionally with re-injuries and the growth of muscle injury classifications and being introduced to that for the first time, and wanting to be able to service the athletes a little bit better.  So I made the call, let’s go down the hamstring route.”


[Daz comment: Side note on on hamstring injury profile:]


Hamstring injuries remain the most frequent muscle injury in elite football, accounting for 34% of all muscle injuries. Even more problematic, they have a high tendency (up to 16%) to re-occur.  


  • The proximal myotendinous junction is the most injured location in acute hamstring injuries and these injuries generally have a shorter return to play time than injuries affecting the free tendon
  • The Bicep Femoris long head has received much research interest as it is the most commonly injured muscle of the hamstring group (more than 80%). It is most frequently injured during sport involving high speed running such as football, AFL, rugby and athletics; injuries occur predominantly in the proximal musculotendinous junction (MTJ)


Key concept:


The most frequently injured of the hamstring muscles is the biceps femoris (BF) in running sports. While these typically occur at the proximal musculotendinous junction (MTJ)  Entwisle, Ling has recently descripted the distal MTJ ‘T-Junction’ of the biceps femoris, formed by a complex confluence of the long head and short head in the distal posterior thigh. Injuries to this location have been suggested to be a more severe variant of HSI that should, like intramuscular tendon injuries, be treated as a distinct clinical entity.


Now back to the interview with Fearghal:


“Initially the decision was made we would do a project where we would look at recovery of neuromuscular factors associated with hamstring muscle re-injury:


  • Strength
  • Fascicle length
  • EMG – activation and recovery in hamstring following injury


We couldn’t do this for a couple of reasons.  One being change in staffing meaning we couldn’t go down the EMG route the way we had hoped, and probably because of the onset of Covid we weren’t able to pursue the research we wanted to.  This meant that it made more sense to pivot a little bit, and I was becoming keener and keener in the area of location specific rehabilitation, and words like T-junction; you’re starting a conversations with people, “how are you managing your T junctions?” I’m seeing these things come up on a MRI scan, and we’re starting to look deeper and deeper into our functional rehabilitation of some of these injuries but are we playing with one hand tied behind our back in terms of the actual pathology and that was a concept that fascinated me because I felt that often we were beating ourselves up in terms of aspects of the rehabilitation, but what I was really interested in was whether we were doing the right things in the first place?


So I pursued that and then we carried out some reasonably large studies looking at our injury data retrospectively and injury location and made some suggestions then through different outputs we had and how that might influence rehabilitation?  I guess, once you’ve shown an interest in an area like hamstring injuries where it is so topical, it’s an emotive area for a lot of people in sport where we tend to feel exposed because we care so much and then we get stung with a reinjury.  People tend to reach out and then you create a network and a community, it’s a lot information sharing and finding out about how people are doing things globally and I guess I just went deeper and deeper down into that space and ultimately that’s probably what ended up allowing me the opportunity to move into my current role.”


“Briefly, where do you think the interest in the rehab space has come from in terms of education but also general interest from not just physiotherapists but S&C coaches like yourself? I think it’s booming.  The interest we get in terms of any sort of rehab content that we put out (even though that’s not the core content) people love, people are lapping it up.  S&c coaches often wanting to upskill in that area because they’re put in a situation where they are doing the late stage and maybe their education hasn’t positioned them to feel confident, and they’re looking for other ways.  What’s your perspective?”


“I completely agree.  I think two things:


  • Personality – of the type of people who go into that space – they often tend to be S&C coaches with a massive growth mindset
  • Evolution – Because you’re so patient facing all the time you have to demonstrate evolution – you have to demonstrate growth.


I guess people take this all very personally when results don’t go to plan.  It’s a fantastic feeling when you get someone back quickly without reinjuring them.  But there is no lower feeling than having to restart and go with a second plan to an athlete and explain why it hasn’t gone the way we wanted to and start from zero again, and try and maintain their trust the second time around.  So I think people are very, very engaged in trying to evolve their practice and personally I think it is a fascinating area; it’s a real blend of application of some principles around anatomical location and delivering S&C programmes that evolves over time – I often say with some of these injuries it’s just S&C for injured players!  This is a really exciting area where we can have some impact with our players, and it’s a major area that is growing and traditionally hasn’t been done that well.  S&C coaches tend to drag physios along traditionally and things like sport science, S&C have lead the way for physios and bringing the next iteration of what sports rehabilitation looks like.”


“So latest thinking on hamstring injury mechanisms from the industry as a whole but yours too?”


“I suppose the first concept on hamstring mechanism it based on Askling’s work which defined two main types of injury- binary and 2-Dimensional, but extremely appropriate and that was that we have:


  • sprint type injuries – involve high speed running
  • stretch type injuries – involve gliding/slide tackle and high kicks


Sprint type work according to Askling’s work will involve the long head of the bicep femorisStretch type work will involve the proximal tendon of semimembranosus, with pain near ischial tuberosity and up to buttock. 


See full article here for further info:


Stretch type injury has an “over-stretching” mechanism so involving hip flexion, knee flexion, trunk flexion type mechanisms.    My perception had been that I think we are starting to see less incidence of players sprinting up the wing and pulling up with a sprint type injury.  I don’t think that’s necessarily something we see as much.  So one of the areas we decided to go down with the PhD was could we describe the actual actions associated with the injury and could we describe the biomechanical position via video analysis.  This had been done with a couple of other injury types for position of injury in ankle and ACL type injuries, and adductor injuries so we decided to follow that for hamstring injuries – see the abstract for the article:


– It’s not all about sprinting: mechanisms of acute hamstring strain injuries in professional male rugby union- a systematic visual video analysis – HERE


Results: Seventeen acute hamstring injuries (HSIs) were included in this study. Twelve per cent of the injuries were sustained during training with the remainder sustained during match-play. One HSI occurred due to direct contact to the injured muscle. The remainder were classified as indirect contact (ie, contact to another body region) or non-contact. These HSIs were sustained during five distinct actions – ‘running’ (47%), ‘decelerating’ (18%), ‘kicking’ (6%), during a ‘tackle’ (6%) and ‘rucking’ (18%). The most common biomechanical presentation of the injured limb was characterised by trunk flexion with concomitant active knee extension (76%). Fifty per cent of cases also involved ipsilateral trunk rotation.


Some other research came out by Thomas Gronwald a few months earlier


– Hamstring injury patterns in professional male football (soccer): a systematic video analysis of 52 cases.  Abstract link HERE


Results: 52 cases of hamstring injuries were included for specific pattern analysis. The pattern analysis revealed 25 sprint-related (48%) and 27 stretch-related hamstring injuries (52%). All sprint-related hamstring injuries occurred during linear acceleration or high-speed running. Stretch-related hamstring injuries were connected with closed chain movements like braking or stopping with a lunging or landing action and open chain movements like kicking. The kinematic analysis of stretch-related injuries revealed a change of movement involving knee flexion to knee extension and a knee angle of <45° at the assumed injury frame in all open and closed chain movements. Biceps femoris was the most affected muscle (79%) of all included cases.


👆 What they found, which challenged a little bit of what had gone before, unlike what had been found Askling, they found the stretch type mechanism ALSO involved bicep femoris.  


So I guess it starts to grow this idea of thinking about the injury mechanism in this 3-D multi-joint, multi-plane mode more than we probably thought about before because when we think of our understanding of kinematics and kinetics, some of that comes from upright treadmill running which isn’t the sport. Many of the Bundesliga injuries involved indirect contact, even some of their sprint type injuries, so thinking probably some kind of contact to the upper body.  So, again, while we traditionally think of hamstring injuries occurring in the late swing phase, what’s the contribution of trunk flexion to that? Of excessive hip flexion? Of trunk rotation?  So moving beyond a linear running model but also one that is more closely matched to the demands of the sport.


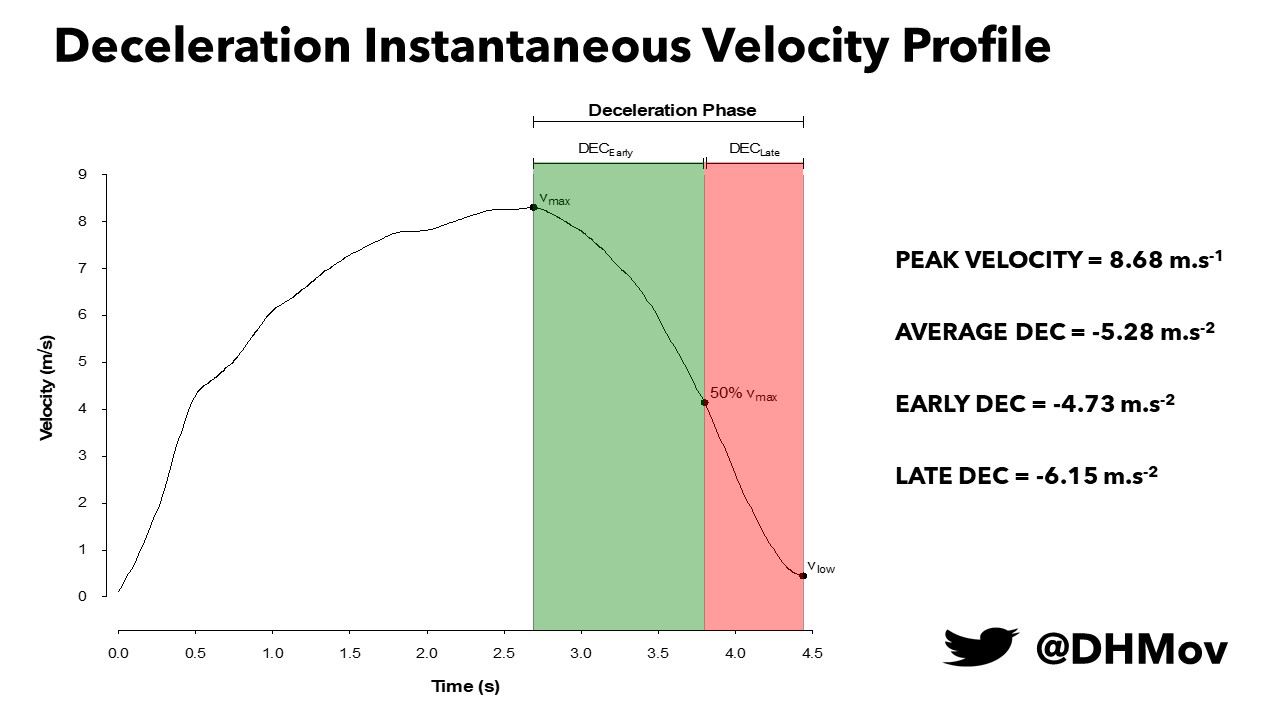
  • Acceleration-deceleration-acceleration again
  • Curved run
  • Duel with an opponent
  • Tackling and overreaching


The point that we tried to make with our slightly catchy title, “It’s not all about sprinting,” was to say that not all injuries occur at high speed.  We described injuries occurring during kicking, running, deceleration, tackling and in the ruck.  Characteristic of those injuries we saw was a combination of:


  • Length
  • Load
  • Speed (rate of loading)


Any combination of those three things can result in hamstring injury.  We then published in our supplementary appendix where we also linked the biomechanical position to certain injury locations.


Do we need to think more of a 3-dimensional sport specific multi-directional rehabilitation strategy?


There are probably lessons to be learnt if we are seeing a consistent pattern of injury location associated with a consistent mechanism of injury.  That tells us a little about how that tissue was loaded and what positions that might be useful to us or should potentially be avoided during certain phases of the rehabilitation, and also it might help from the diagnostic perspective because certainly at some levels of the sport we don’t always have MRI available to us.  There are certain heuristics and rules of thumb, where if you can say to a clinician that with this mechanism we may want to be suspicious of this particular type of injury then that can be very, very helpful too.


“So are you still thinking along the same lines or have you moved on anything based on the experiences you’ve had in different sports and athletes?”


“No.  I think we’ve confirmed some key factors.  In involving these discussions with others, it’s what people tend to see.  A lot of people would share the feeling you don’t tend to see that many sprint type hamstring injuries anymore, as in purely linear sprint type hamstring injuries.  They tend to be associated with another action, be that some kind of change of direction or speed, some kind of contact or change of position of the upper body.


Whether that’s because athletes are stronger now than before; the Nordic curl research in football showed that 337 Newtons and being below that with short fascicle length puts you at risk of injury.  When we think that most athletes are quite a bit above that now as an average and perhaps we’re no longer having weak athletes that are below that strength threshold, we can now tolerate linear sprinting but now it’s certain other positions that we more likely get an injury associated with different types of mechanisms in slightly stronger athletes.  That could be different parts of the muscle, more frequently the intramuscular tendon, or influence different parts of the actual muscle itself so thinking a greater percentage of distal hamstring injuries than would have been described in research 10 years ago, I think we’re starting to see a different profile of hamstring injuries and that’s likely, in my opinion, related to changes in the sport and changes in the athletic profile.”


Distal Bicep Femoris Long Head (A biarticular hamstring muscle)


“T junction and hamstring injuries.  Just give us the basics – what is T junction for anyone who is listening and thinking, what is that?”


“I had a familiarity with the Tom Entwisle paper “Distal Musculotendinous T Junction Injuries of the Bicep Femoris” which originally described the anatomy of the T junction and I was aware it was something we were starting to see on MRI reports but hadn’t realised it was probably an area I needed to have a specific approach for.  So what is the T junction? It’s the confluence of the long and short head of the bicep femoris.


The bicep femoris, as its name suggests, has two heads – the long head (which is the bi-articular component) and the short head, arising more distally (mono-articular hamstring muscle, meaning it only crosses the knee joint).  They form at the T junction because it’s a T shaped structure and it is thought to be an area of the hamstring that is either at particular risk of injury, or will certainly be more complicated when it gets injured because 1) it’s a complex area and doesn’t really fit within any grading or classification structure in terms of the anatomy of the structure itself but also 2)  there are duel force vectors and different angles from the long head and short head when they join together.  There is also a duel nerve supply with a bi-articular function and lengthening of the long head during hip flexion and knee extension, with the contribution of short head to knee flexion.


Entwisle et al describe the distal musculotendinous T junction (DMTJ) of the biceps femoris where the opposing anterolateral aspect of the long head and the posterolateral aspect of the short head form the musculotendinous junction which appears as a T-shaped structure.  They report higher reinjury rates involving this DMTJ of biceps femoris muscle in their cross-sectional study of 106 injuries in Australian Football players. The reinjury rate was 54%, with 86% of subsequent injuries being the same or of higher grade than the index injury.


So with such a high reinjury rate (54%) then the challenge becomes how do you then manage these injuries? Do they need much longer time? Does that mean that they need a specific type of rehabilitation?  Does it need an intervention of some sort such as surgery etc?


In our own analysis of injuries [in Rugby], we were able to determine that for us 20% of our hamstring injuries during a 5 year period involved the T junction, and about half of our distal hamstring injuries were T junction injuries.  So I would say that if you had a distal hamstring injury, based on our findings in that group and in that sport (rugby), at that time, there is a 50:50 chance your distal hamstring injury may extend within the T junction.


It is suggested that these injuries don’t heal as well and heal as cleanly as other type of hamstring injuries.  They settle asymptomatically in 3-4 weeks (and in my experience they settle in 2-4 days).  They feel good really, really quickly and you take them up to 70% and everything looks great.  Then as soon as you add sport specific demands to your T junction injuries (whether that’s specifically around rotation) or whether that’s acceleration and reaching and trunk flexion (more proximal) and particularly trunk rotation (more distal) for these injury types you then get a second injury, and that’s when things become more challenging.  Particularly with your quicker athletes, I think your chances of you getting a good outcome on these I think is traditionally thought to be lower.  And some of it is probably because our assessment is limited; what we do on the bed, what we do from a strength diagnostic point of view, we don’t have strong rotational tests and probably due to the nature of the injury having a shearing component these injuries appear to be good really quickly and then they tend to let us down.


Probably what I see and what I talk about is I think there is a very consistent injury mechanism – it’s trunk rotation.  I think it’s the ratio of different components of movement that define injury location.


More proximal injuries tend to be more trunk flexion.  Distal injuries tend to be more trunk rotation.


Because the distal injury mechanism seems to be related to trunk rotation that probably explains why we can take them through a clinical assessment and they look good, and we can take them through the early stage of rehabilitation and they look good but we’re not actually sufficiently or appropriately shearing the injury location to determine whether it is actually a stable configuration.”


“You mentioned location specific rehab.  Would you be able to give us a few examples so people can really get a sense of how that looks in practice?”


“If we are saying that there are different injury sub types then the principle comes from let’s say 30% of hamstring injuries reoccur, so within that, 70% don’t.  So the question then is, is there something specific in those 30% that causes them to reoccur? Is it that it’s the intramuscular tendon, the T junction or what exactly is it?


We think most injuries return within 3 weeks but the end stage of muscle healing is 6 weeks and beyond.  If we think that certain injury locations are likely to break down then do we give consideration to anatomical healing more so in those cases, and then are there specific actions that should be taken during the rehabilitation process that respects the anatomical healing?


If we take a location specific approach it’s across the entire process, so I’ll split all my rehabilitation considerations into:


  • Anatomical
  • Functional


The first principle of the British Athletics Muscle Injury Classification (BAMIC) approach of hamstring muscle rehabilitation is to establish an actual structural diagnosis and I think that’s absolutely critical and it certainly underpins location specific approach.  Once you’ve determined that you can then set expectations around what is a normal time to return to play for this athlete.  We can then start to periodise what we do within that time.  We can then reconsider the reinjury risk and then start to think about what are the influences of this on tissue loading, is this is an injury that is going to respond to specific types of loading ie. are we trying to get a specific adaptation within the muscle tendonous junction, within the intramuscular tendon? Can we lean into research from other disciplines, other tendinopathy research and can we learn about heavy slow resistance and how can that be applied to it too?


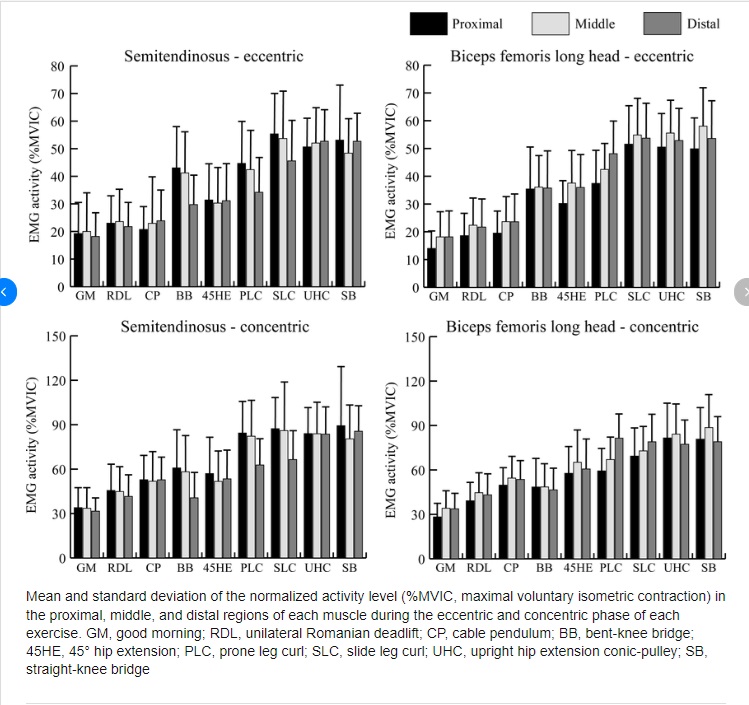
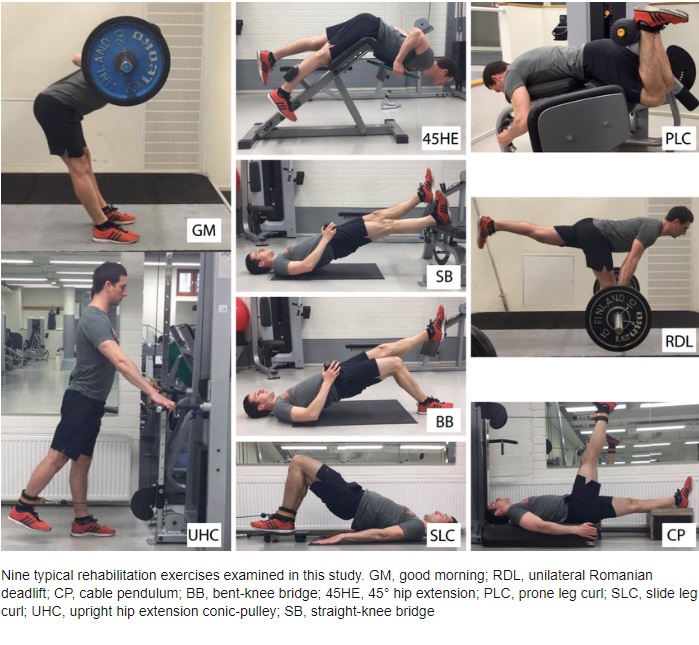
We can also think specific type of injuries that bias particular locations within the muscle, ie. if we know that hip hinge type exercises (research points to 45 degree hip extension exercise, primarily for me I would use the RDL as my main hip hinge exercise) well we know that is going to have the greatest activation of the proximal hamstring.  So perhaps if we have a proximal hamstring injury we might delay the hinge type work until later on in the rehab.   We might delay outer range eccentric exercises initially because we are trying to respect the anatomy of the injury because we have deemed that to be important.”


[Daz comment: Side note on muscle healing 👇 – from article: WHAT IS A HAMSTRING INJURY?]


As clinicians dealing with hamstring muscle injuries, it is pivotal to understand the basics of muscle healing to optimise our rehabilitation of these injuries. Simultaneously, this knowledge is useful to manage stakeholder expectations and most importantly, the athlete’s risks of (early) return to sport. Most muscle injuries happen at the MTJ. This area is frequently thought of as the weakest link in the chain, because the MTJ is where the projections of the myofibers interface with the connective tissue.


Fibroblasts deposit scar tissue in the gap and as this scar tissue matures, it forms new MTJs with the stumps of the damaged fibres. This maturation is driven by mechanical loading. This is exactly the process where the clinician can provide the most benefit through mechanotherapy.  Traditionally, management of acute hamstring injuries (or other acute muscle injuries) included a set amount of days of treatment with (P)RICE, usually combined with passive/active stretching before active loading is commenced. However, there is no strong evidence supporting this approach when managing acute hamstring injuries in the early period. Bleakley et al already suggested a revision of this model called POLICE, adding in Optimal Loading (OL) as a replacement for Rest (R). The aim is to encourage clinicians to think about the optimal progression of rehabilitation and apply an appropriate loading strategy during the first crucial days of rehabilitation. Most likely, relative rest is not ideal as confirmed by recent studies suggesting that an early start with rehabilitation expedites return to sport.  Considering the anatomy, physiology and mechanotherapy presented here, we might suggest a basic clinical guideline:


Respect the healing tissue, but start loading early!


Now back to the podcast interview:


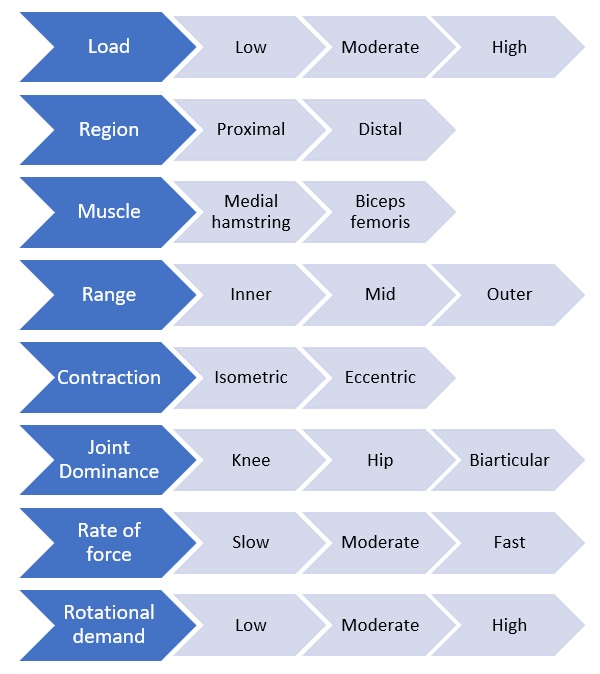
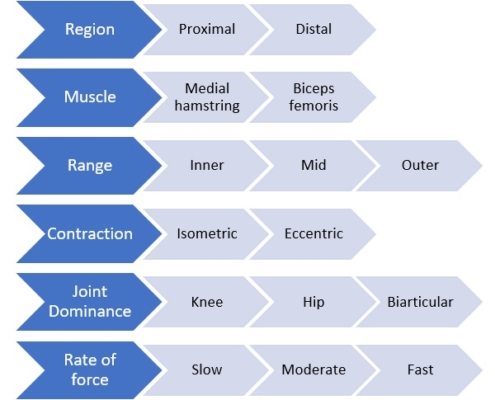
“So then we can periodise accordingly if we think that there are specific types of exercises that may overly stress the injury location, perhaps we are going to allow for an initial protective or early loading phase where we will control the:


  • contraction type – we might start with isometric in the first instance, and delay eccentric until a certain time point
  • length – not overly stressing towards outer range.  So if we are doing knee dominant work we will do from inner to mid range
  • load – change rep range
  • control – delay unanticipated movements and keep the rehab 2-dimensional in the first instance


High-density electromyography activity in various hamstring exercises


We can control these factors and layer them in over time.  Using RDL as an example we could:


  • Range – change to a rack pull
  • Load – make it supramaximal for certain parts of the movement or make it light and use it as a movement patterning exercise
  • Perturbations – while they are doing an isometric hip hinge hold I can perturb them with a Swissball or they could do bounds ending up in an RDL position, or they could bounce a ball in that position, and even adding in some rotational components to it and some unanticipated movements.


Given that early recurrence is a key feature is this injury, the pace of progression is critical. If attempting to offload the distal BF, exercises that preferentially activate the medial hamstring or proximal BF may be indicated. In addition, initially restricting range of motion and rate of force development, as well as muscle length across the two involved joints are characteristics of exercise selections that can be manipulated and progressed, while still giving consideration to prioritising the adaptations that might be necessary to prevent recurrence.


What environment are we trying to create?  Can we create an environment eliminates those signs of re-injury on an MRI through early injury specific rehabilitation that allows for a resolution of the oedema and return of tension by appropriately staging our rehabilitation? So that by the time we actually progress through the rehabilitation we have actually achieved the goals: we have increased their eccentric strength, we have increased the fascicle length and we have prepared them for the game.  Can we create an environment where the scan looks good, we have a return of tension and not overly stressed them but they are now ready to progress back into the sport safely.  We have ticked off the functional components of the rehabilitation to return to where they were before while also possibly getting the adaptations they needed at the injury location itself.


British Athletics first reported their re-injury rates for C type injuries at around 60% back in 2016, so similar to the T-junction type injuries, on the absolute higher end.  For those athletes it is  important to note that when we talk about the British Athletics research, we’re talking about really really quick guys so we are not talking about a field sport, a change of direction/reactive team sport.  But we are talking about about athletes whose speed is well above 10 m/s and are certainly super elite athletes with re-injury rates of 60%.  They described through their approach in Ben McDonald’s paper on hamstring rehabilitation (2019) framework with examples of 2b and c hamstring rehabilitation exercises.  I always If you could only read one paper for hamstring rehabilitation injury I would just refer to this paper.  It’s an absolute must read, very digestible and has examples of 2b and 2c type rehabilitation type programmes from track & field based sport.  It’s a seminal paper for me.


But how can we have our management influenced by muscle injury location to change from 60% to a re-injury rate down to something that more matches some of the other injury locations?  They put their money where their mouth is and published their findings after applying this framework and they had dropped from 60% re-occurrence rate down to 0% in C type injuries within a 4 year period!


This is contentious because there is different methodologies across the literature.  We can compare their outcomes with other sports but it’s not the same, they are much quicker.  For their 2c type injuries they returned in 5 weeks and for their 3c type injuries 7 weeks with successful outcomes.  But how do you copy & paste that to field sports?


  • Should that field sport athlete take a little bit longer – because once we get them to say 5-7 weeks we now need to add in a sport specific acceleration-deceleration ball work reactive phase?
  • Or do we need to take a little bit less time – because the athletes don’t hit the same absolute massive speeds that the track & field athletes do?


So it’s difficult to copy & paste that with any other sports.  There is also research carried from Qatar and the group at Aspetar and they showed within their cohort they didn’t see a increase in reinjury and they only see a small difference in time to return to play so they would conclude that intramuscular tendon injuries don’t warrant being defined as a distinct clinical entity.  This was a unique study because the researchers and athletes were blinded to the specific injury profile.


We found in our research [from Leinster] that C type (intramuscular) injuries took three times longer than other types of A and B type injuries but you can very justifiably argue that, “well, of course they did because weren’t blinded with the outcomes and you think they take longer, so of course they take longer!  We didn’t have higher reoccurrence rates for intramuscular tendon injuries, but we also took three times longer so I guess taking longer you’d want to have lower reoccurence rates than other injury types.


Because of the difference in methodologies, because of the difference in sports we can’t compare across but for what it is worth, my opinion experientially , this injury location warrants being treated differently.


TO BE CONTINUED………


Top 5 Take Away Points:

  1. Hamstring injuries remain the most frequent muscle injury in elite football
  2. Two main types of injury- binary and 2-Dimensional, but extremely appropriate and that was that we have: sprint type injuries – involve high speed running & stretch type injuries – involve gliding/slide tackle and high kicks
  3. Limitation in current assessment of injuries – need to think more of a 3-dimensional sport specific multi-directional rehabilitation strategy?
  4. Injury mechanism – More proximal injuries tend to be more trunk flexion.  Distal injuries tend to be more trunk rotation.
  5. Rehabilitation model – need for more location specific approach.  Respect the healing tissue, but start loading early!


Want more info on the stuff we have spoken about?

You may also like from PPP:

Episode 502 Gerard McMahon

Episode 481 Kelvin Giles

Episode 464 Duncan, Danny & Rhys 

Episode 473 Aaron Cunanan

Episode 457 Dan Tobin & Dan Grange

Episode 456 Danny Foley 

Episode 450 Tony Blazevich

Episode 446 Hailu Theodros

Episode 444  Jermaine McCubbine

Episode 443 Nick Kane

Episode 442 Damian, Mark & Ted

Episode 436 Jonas Dodoo

Episode 432 Les Spellman

Episode 414-418 Pete, Phil and Nathan

Episode 413 Marco Altini

Episode 410 Shawn Myszka

Episode 400 Des, Dave and Bish

Episode 385 Paul Comfort

Episode 383 James Moore

Episode 381 Alastair McBurnie & Tom Dos’Santos

Episode 380 Alastair McBurnie & Tom Dos’Santos

Episode 379 Jose Fernandez

Episode 372 Jeremy Sheppard & Dana Agar Newman

Episode 370 Molly Binetti

Episode 367 Gareth Sandford

Episode 362 Matt Van Dyke

Episode 361 John Wagle

Episode 359 Damien Harper

Episode 348 Keith Barr

Episode 331 Danny Lum

Episode 314 Les Spellman

Episode 298 PJ Vazel

Episode 297 Cam Jose

Episode 295 Jonas Dodoo

Episode 292 Loren Landow

Episode 286 Stu McMillan

Episode 272 Hakan Anderrson

Episode 227, 55 JB Morin

Episode 217, 51 Derek Evely

Episode 212 Boo Schexnayder

Episode 207, 3 Mike Young

Episode 204, 64 James Wild

Episode 192 Sprint Masterclass

Episode 183 Derek Hansen

Episode 175 Jason Hettler

Episode 87 Dan Pfaff

Episode 55 Jonas Dodoo

Episode 15 Carl Valle


Hope you have found this article useful.


Remember:

  • If you’re not subscribed yet, click here to get free email updates, so we can stay in touch.
  • Share this post using the buttons on the top and bottom of the post. As one of this blog’s first readers, I’m not just hoping you’ll tell your friends about it. I’m counting on it.
  • Leave a comment, telling me where you’re struggling and how I can help


Since you’re here…

…we have a small favuor to ask.  APA aim to bring you compelling content from the world of sports science and coaching.  We are devoted to making athletes fitter, faster and stronger so they can excel in sport. Please take a moment to share the articles on social media, engage the authors with questions and comments below, and link to articles when appropriate if you have a blog or participate on forums of related topics. — APA TEAM


=> Follow us on Facebook

=> Follow us on Instagram

=> Follow us on Twitter

Pacey Performance Podcast Review – Episode 502 Gerard McMahon

First things first, I have an apology to make.  In 2023, I managed to post in 9 of the 12 months – 24 posts in all, so not a bad run averaging two a month.  2024 hasn’t been a great year for writing blogs with only two so far, and it’s already September.


Truth be told, I decided to develop myself in other areas of my business from April to August 2024, delving deep into social media marketing approaches and AI using ChatGPT.  That didn’t leave a lot of mental energy left for S&C specific blog writing and I didn’t feel this blog was the right vehicle to write about my digital marketing and AI learnings (but tell me if you feel otherwise and would like to hear about it!).


I’m back at it now, and I’ve got quite a few Pacey Performance episodes to review as well as some updates on the APA Method and some of the projects I’ve been working on.


In today’s blog I’m bringing you another Pacey Performance Podcast Review.  This podcast came at a great time as I have been reflecting on the APA Method in recent days.  Whenever you onboard a new member of staff (we have recently recruited a new part time and full-time S&C coach in one of our Tennis Academy contracts) it’s naturally a good time to reflect on your keystones or “pillars” of the programme.


Episode 502 – Gerard McMahon – “Activation exercises: Are they really improving performance or preparing your athletes?”

Gerard McMahon

Background

In this episode of the Pacey Performance Podcast, Gerard McMahon joins us to discuss “activation” exercises and their role in improving performance and preparation. Activation exercises have long been touted for their ability to improve performance by targeting specific muscle groups and maximizing motor unit recruitment. However, Gerard challenges this notion, suggesting that these exercises, often misunderstood and misapplied, may not be as beneficial as many people think.

🔉 Listen to the full episode here


Discussion topics:

‘Let’s set the scene.  What does muscle activation actually mean from your experience and knowledge, and how does that differ to what people actually think it means?”

”Really the neuromuscular system, muscle activation is pretty much it’s bread and butter function.  Muscle activation is a very, very simple function for the neuromuscular system to carry out.  If we’re talking about muscle activation and actually look at how it’s quantified and what it is quantifying, muscle activation is the combination of motor unit recruitment and motor unit firing rate (the number of action potentials discharged by a motor unit).


Motor unit recruitment is where we gradually (according to the Henneman Size principle) and depending on how much force we want to create, we recruit generally larger and larger motor units and the firing rate is the number of action potentials discharged that come with that.  The two of those processes control force levels and combined together they are “muscle activation.”


If you’re talking about what people understand it to be, it’s a little bit different.  I doubt that they know that that’s how muscle activation is quantified.  It’s one of the first questions I ask people.  They will probably throw out a bit of technical jargon but they don’t actually understand how it’s quantified and what it reflects as a measure.  They might draw parallels with post activation potentiation (PAP) which is a completely different thing.  So I think there is general confusion both around what it is and what specific processes you are referring to as well.”


“From your experience, why has this term [activation] found its way into the common language, when clearly the explanation of what it actually is doesn’t seem to come together?”

“I’ve had this conversation a few times with different practitioners, but a couple of us think it might have originated from the sports medicine world potentially, where you have either a clinical population or potentially an athlete population that is injured, or rehabbing and there are with some of those conditions issues with muscle activation.  But, the problem with taking it from the context that is used in those populations, and the way that it is being referred to there, to move that to a healthy population where you are warming up those athletes where there are no issues and anything wrong with, it’s completely superfluous; it’s unnecessary to go down that route because they are healthy.  So I think the practitioners have become seduced by the language, as much as anything.  It sounds really fancy, it sounds as though it is going to be really impactful.


If you want to sprint you activate muscles, if you want to stretch your backside you activate muscles, if you want to blink you activate muscles, it’s literally the bog standard function of the neuromuscular system.  It came probably from the clinical world, sports medicine world, it filtered in but it is out of context because a lot of people use it with heathy athletes when it’s completely unnecessary.  We’ve seen it appear in for example a RAMP protocol for a warm-up:


  • Raise Heart rate
  • ACTIVATE
  • Mobilise
  • Potentiate


So coaches are coming across these terms in some of our neurophysiology textbooks with guidelines for working with athletes but again, to me they don’t make much sense in those contexts either.


“So what factors affect muscle activation levels?”

“Really if you go back to what affects muscle activation, you have to go back to the fundamental way it is measured and quantified which is a combination of motor unit recruitment and motor unit firing rate (also known as rate coding).  So, if people want to increase muscle activation they have to increase either motor unit recruitment or rate coding or both of those in combination.  Those are the two big ones, there are one or two other but those are the two you want to be looking after if you want to increase activation.


The two ways to increase muscle recruitment and motor unit firing rate is:


  • Muscle force – you have to generate more and more force to drive up motor unit recruitment


It depends on the muscle group as well.  If you take the adductor polis in you hand, a small muscle found in the hand full of slow twitch fibres, its motor unit recruitment is maximised (completely maximal) at about 30% of maximal voluntary contraction (MVC).  So only 30% of your maximum effort and you have recruited all of the muscle fibres within it already.  So with the bigger mixed muscle groups that contain a bit more Type II (fast twitch) muscle fibres, they might take a bit higher forces – so you’re probably looking at anywhere between 75-85% MVC for those muscles.  So the large muscles with the bigger motor units (because they contain more muscle fibres) require more force.  Because most sports involve those big muscle groups and motor units (quadriceps, hamstrings, Gluteals etc) that’s going to take higher forces to get up to the maximum recruitment.  The key thing is that it doesn’t need to be a complete maximum force/effort to get all of those motor units involved.


Rate coding – motor unit recruitment can be maximised at submaximal levels (most of them are between 50-85% MVC) but actually rate coding is much more important that the motor unit recruitment for the highest forces that you want to produce.


  • Develop force rapidly – so speed or power.  The control of that is slightly different as you don’t get maximal motor unit recruitment because you don’t have time essentially, to get all of those motor units and you don’t develop maximum force as well.  But what you do do with a fast or powerful contraction is you do get very, very high amount of action potentials discharged (firing rates).   You go through far higher discharge rates during a fast contraction than you do through a maximum isometric contraction, for example.


So, in a nutshell, if you want to get high muscle activation the muscle contractions need to involve HIGH FORCES or submaximal forces with a HIGH VELOCITY.


So, that’s what your exercises need to look like if you want to attain high muscle activation, by definition.  There are other smaller matters like the joint angle, as the joint angle will change the muscle’s length, and at different muscle lengths there are better muscle activation levels.  So, when a muscle is fully extended, if you take the knee joint for example, when the leg is fully extended activation doesn’t tend to be as high during maximal efforts, or if it’s really flexed like if you’re deep down in a squat, activation isn’t quite as high either.  You tend to get the best activation of the quadriceps in and around moderate to slightly long muscle lengths, that pretty much follows the force-length relationship of those muscles.


Muscle temperature has the potential to decrease rather than increase the activation so if the muscle temperature is raised too much you may get a decrease in muscle activation but again the affects of that are not particularly high unless the muscle temperature is exceedingly high.  Joint angle and muscle temperature play very much second fiddle to the big ones which are muscle force and contraction velocity.


“In terms of quantifying it, where has this confusion around EMG come into play?”

“EMG is a very useful measure.  That is a global representation of muscle activation, it’s more of a mathematical representation of it more than anything, and it contains (the EMG amplitude that you see, the EMG reading) information both on motor unit recruitment and the motor unit firing rate.  But it is NOT an exact representation of that, because what you need to do to get those numbers out for motor unit recruitment and the motor unit firing rate, is you need to decompose that surface EMG, which is where high density EMG comes into it, where you’ve got mathematical algorithms etc and ways of breaking down and decomposing those signals.  So they’re quite complex and representative but where a lot of people go wrong is in the interpretation of those amplitudes and what those amplitudes mean because they are affected by so many different factors that you have to account for, the underlying physiology and the metabolic condition of the muscle and things like that.  They all affect the neural system so it’s not a very simple, straightforward cause and effect.  You can get changes in EMG without the muscle making any more force, without a change in function.  But you can also get a neural change that does match the function.


If you look at EMG I would argue it’s absolutely meaningless without other measures to back it up such as a force measure or something that is able to show you what function changes as a result of that change in EMG amplitude.


What comes along with activation, when practitioners talk about how I’m doing this exercise to increase muscle activation, they don’t ever measure it!  You’ll find GPS units, you’ll find heart rate monitors, you’ll find all sorts of different monitoring tools but muscle activation seems to be for some reason that thing that people say they’re trying to do, but they don’t ever try to quantify it using EMG.  But I wouldn’t necessarily try to encourage that anyway, because unless you have a background in it, you need to have such tight controls and processes as part of your EMG methodologies so it is not something you decide I want to start doing tomorrow, pick up electrodes and run with it.  You have to have a very good background because how stringent your EMG methodologies are dictates how good quality data you have and actually what kind of inferences you are trying to make with whatever you’re trying to measure.  So it really is a minefield and also with advances in technology we are still learning a huge amount of things about the neurological system so it’s not the sort of thing you can dip your toe in and use here and use there, you need to be consistent at using it.


“EMG shorts, not to throw any companies under a bus, people are probably wanting to replicate what they see in these studies and rank exercises based on activation but what value do they bring?”

“I would argue minimal.  The biggest limitation of surface EMG to begin with, no matter how good you are at  it, it’s based on the skin and the skin can move relative to the underlying muscle, so that’s one thing you have to be really careful with when you’re interpreting EMG because how close you are to the neuromuscular junction changes the EMG amplitude signal on its own regardless of changes in force.  So if your skin is moving at all relative to that, that’s changing the amplitude, not anything to do with the exercise you’re doing.  That happens at the best of time in EMG, so if you have EMG in shorts or a piece of clothing that’s embedded in the fabric, that fabric is also sliding over the skin as well so how you can have any idea or be able to make any valuable inference between what you’re recording through EMG shorts and what’s happening in the underlying muscle when you’ve got skin and fabric sliding all over the place – I don’t think you can make those sorts of calls.  It’s a nice idea but again you have to be aware of the underlying limitations of what you’re measuring and the validity and reliability of those, and if the validity and reliability is poor it’s not worth doing.”


“Where has the use of low level activation often using bands pre warm-up come from?”

“That practice did come out of left field over the last 10-15 years and I don’t even remember the last time I’ve seen a warm up without someone using some sort of band.  I think it was probably from the sports medicine world, and this is not me blaming them by the way, it’s just been moved out of context from where it has been used appropriately, to out of context and not used appropriately.  Probably if they’ve had an injury and they’re doing some work around that injury, and the physio and doctor may have communicated that they were using a band to activate such and such muscle, so the athlete goes “oh, I must need a band to activate this muscle,” without being familiar with what the definition of muscle activation actually is.


The practice then just falls incredibly short of theoretical rational so again we go back to the practice where the bands are taken out and the exercises are used, I suppose to be clear, the bands aren’t the problem per se.  It’s relative ease or lack of stiffness of the bands.  So some of the bands are quite tough and stiff and not easily stretched.  If you put force and effort against the band that you can barely move, that will activate the muscle okay.  But what we do see in practice often is very, very low resistance bands being used for the exercise that aren’t challenging the muscle to produce force.  They aren’t performed with any speed so again going back to motor unit recruitment and motor unit firing rate, if you do activities that don’t require much force or don’t require much velocity you aren’t increasing muscle activity levels at all, and that kind of defeats the purpose of what you’re trying to do.


Following on from that is the specificity of it all.  When we look at a lot of the big gross locomotive motions (jumping, sprinting, change of direction) and we have our EMG research done on those types of activities, those activities get you much higher muscle activation than any of those band activities (60-100% EMG).  Those band activities usually quantify anywhere between 20-40% EMG (clams, monster walks).  If you’re going to running in the game, then run in your warm up to increase your muscle activation.  Why on Earth would you try and do an isolated exercise to replace it when it going to give you a low level of activation.  And if running is going to be part of your warm up anyway and supersedes that band work, again, what has that band work achieved?


If you’re coming back from injury and you’re returning to sport you would need to be in very bad shape or have a very specific ongoing injury that is going to affect muscle activation that’s going to require any specific activation.  You should regain in most cases in most injuries full neuromuscular properties back again.”

Top 5 Take Away Points:

  1. Definition of muscle activation – the combination of motor unit recruitment and motor unit firing rate.
  2. Two ways to increase muscle recruitment and motor unit firing rate is: generate more force, or develop (submaximal) force rapidly.
  3. EMG – make sure you back it up with a measure such as a force measure or something that is able to show you what function changes as a result of that change in EMG amplitude.
  4.  Measure what matters – when practitioners talk about how I’m doing this exercise to increase muscle activation, they don’t ever measure it!
  5. Bigger is better – big gross locomotive motions (jumping, sprinting, change of direction) and we have our EMG research done on those types of activities, those activities get you much higher muscle activation than any of those band activities (60-100% EMG).


Want more info on the stuff we have spoken about?

You may also like from PPP:

Episode 481 Kelvin Giles

Episode 464 Duncan, Danny & Rhys 

Episode 473 Aaron Cunanan

Episode 457 Dan Tobin & Dan Grange

Episode 456 Danny Foley 

Episode 450 Tony Blazevich

Episode 446 Hailu Theodros

Episode 444  Jermaine McCubbine

Episode 443 Nick Kane

Episode 442 Damian, Mark & Ted

Episode 436 Jonas Dodoo

Episode 432 Les Spellman

Episode 414-418 Pete, Phil and Nathan

Episode 413 Marco Altini

Episode 410 Shawn Myszka

Episode 400 Des, Dave and Bish

Episode 385 Paul Comfort

Episode 383 James Moore

Episode 381 Alastair McBurnie & Tom Dos’Santos

Episode 380 Alastair McBurnie & Tom Dos’Santos

Episode 379 Jose Fernandez

Episode 372 Jeremy Sheppard & Dana Agar Newman

Episode 370 Molly Binetti

Episode 367 Gareth Sandford

Episode 362 Matt Van Dyke

Episode 361 John Wagle

Episode 359 Damien Harper

Episode 348 Keith Barr

Episode 331 Danny Lum

Episode 314 Les Spellman

Episode 298 PJ Vazel

Episode 297 Cam Jose

Episode 295 Jonas Dodoo

Episode 292 Loren Landow

Episode 286 Stu McMillan

Episode 272 Hakan Anderrson

Episode 227, 55 JB Morin

Episode 217, 51 Derek Evely

Episode 212 Boo Schexnayder

Episode 207, 3 Mike Young

Episode 204, 64 James Wild

Episode 192 Sprint Masterclass

Episode 183 Derek Hansen

Episode 175 Jason Hettler

Episode 87 Dan Pfaff

Episode 55 Jonas Dodoo

Episode 15 Carl Valle

Hope you have found this article useful.

Remember:

  • If you’re not subscribed yet, click here to get free email updates, so we can stay in touch.
  • Share this post using the buttons on the top and bottom of the post. As one of this blog’s first readers, I’m not just hoping you’ll tell your friends about it. I’m counting on it.
  • Leave a comment, telling me where you’re struggling and how I can help

Since you’re here…

…we have a small favuor to ask.  APA aim to bring you compelling content from the world of sports science and coaching.  We are devoted to making athletes fitter, faster and stronger so they can excel in sport. Please take a moment to share the articles on social media, engage the authors with questions and comments below, and link to articles when appropriate if you have a blog or participate on forums of related topics. — APA TEAM

=> Follow us on Facebook

=> Follow us on Instagram

=> Follow us on Twitter

Tennis Conditioning – How to Get Fit in Four Steps Without Running

In today’s post APA coach Kostas Tsitmidellis shares his insights on a recent experience he has had working at WimX Tennis Academy as Lead S&C coach, and the challenge of improving the endurance of the players with limited time to get the job done.


Endurance for Tennis


Players were tested using a yo yo intermittent recovery test; if you’re not familiar with this test it is a 20m shuttle-based endurance test that we use at APA to give us confidence that our athletes are fit enough to meet the intermittent endurance demands of the sport of tennis.


Yo-Yo Intermittent Recovery Test Level 1 (YYIRTL1)

• Goal for Pro Males- Level 20.1 IRL1; 17.5 km/h (4.86 m/s)
• Goal for Pro Females- Level 17.2 IRTL1; 16 km/h (4.44 m/s)


For yo-yo to MAS conversion: [1.34*running speed – 2.86] e.g., 1.34*17km/h-2.86 = 19.9 km/h


Based on the targets above, the findings were that the players could do to improve their endurance.  I ask Kostas to come up with a plan and here is what he came up with.  I’ll pass you on to Kostas 👇


“Before getting into the conditioning progressions and how they can be incorporated into the tennis drills I am going to highlight a couple of points of interest:


  • In a singles match there are about 60 high-intensity actions that players need to perform – these include hard and fast decelerations and re-accelerations.
  • On the court, players need to be fast enough to reach 6 m/s by their third step of a sprint.  If they can do this we are confident they are fast enough.
  • Off the court, players need to be fit enough to run at an average speed of 18 km/h for a sustained period of high intensity work- the best male athletes can do this for all 6 minutes on our time trial test.  If they can do this we are confident they are fit enough.
  • All things taken together, we need players who are fit and fast enough to meet the varied game demands of competitive elite tennis.


So this lead me to consider how best to go about improving the endurance of tennis players?  In this article we will be focusing on the endurance part (players capable of reaching 18 km/h, which by the way, is also the speed that the top male athletes get when they meet the requirements of the yo-yo test, 17.5 km/h or higher).  We want to train in a way that players get exposure to those higher running speeds to build aerobic fitness but while at the same time preserving speed qualities.


Running vs. Footwork


It is important to mention that the optimum way to reach those cardiovascular adaptations is through running.  That is because it is a low skill activity that everyone can do easily, is much easier to individually prescribe (metres covered, time) and subsequently is easier to track progress and periodise for.   On the other hand, constraints such as availability of time and sport specificity considerations might discourage a strength & conditioning coach of going for the running option.  As well as this, players will not happily appreciate running up and down, and tennis coaches might not be happy witnessing players coming into the tennis training session already fatigued.


Thus, I had a thought on how I could support the tennis coaches incorporate running components into the tennis drills, and following discussion, we came up with some tennis specific conditioning drills.  Please note that I am not a tennis coach myself.  So those drills were just suggestions and tennis coaches could use them and also develop them.


Stage 1 – Aerobic


What does it look like off the court:

  • Continuous runs or long and easy paced intervals > 1-min (80-90% MAS)


What could it look like on-court: (1 vs 1)

  • Long and easy rally between two players > 1-min.  However, intuitively it sounds better to prescribe tennis players with “ball count” rather than a time.  After discussing with the tennis coach we agreed that 40-50 ball rally for 1:00-1:30 minutes seemed reasonable.  No mistakes allowed, they have to return every ball!


Stage 2 – Aerobic-Anaerobic


What does it look like off the court:

  • Introduction to acidosis and lactic acid consumption in the blood.
  • 20-30 seconds all out effort sprinting but with extensive rest after (could be active rest but in the early sessions will probably be passive rest) with 3-minutes to recover.  This type of session format is all about giving an early exposure to an anaerobic regime, but with plenty of time to recover so the body can adapt.


What could it look like on-court: (1 vs 2)

  • One player on one side of the net and two players down the other end.    Players in the pair are considered to be on their “active rest” while they hit to the other person for 20-30 seconds, who will be moved around a lot and will need to sprint to make the balls.  The person on their own has to return back every ball.  Technically this is an all out effort that someone can sustain for 20-30 seconds.
  • Tennis coach will shout “change” which is the cue for the player on their own to walk to the opposite side.  When they get there they then have two rounds being part of the pair, before walking back to the singles.  That’s 2:30 min of active rest , including the 30-sec to account for the player walking down the other end.


Stage 3 – Anaerobic-Lactic


What does it look like off the court:

  • 20-30 seconds high intensity effort, but not as high as Stage 2, because here we will have short rest periods as well, exposing athletes to high levels of lactate for prolonged periods and resisting fatigue.  In a running set up this could look like 120-130% MAS with a short active rest (walking or jogging) of 20-30 seconds.


What could it look like on-court: (1 vs 1)

  • This can be 1 vs 1 with one of the players only feeding the ball (active rest) and the other player trying to return every ball (again, might be good to measure how many balls they hit)
  • Remember, we want this to be a bit easier than Stage 2 because the rest is very short.  After 20-30 seconds they swap roles.  This is a nice one to sell to tennis players by saying that 20 seconds is how much rest you get in between points in real matches.


Stage 4 – Repeat Sprint Ability


This can be considered an advanced phase where the athletes will be aerobically-anaerobically capable, as seen by their ability to now repeat sprints with short rest periods.


What does it look like off the court:

  • 6-10 seconds all out sprint.  Work to rest ratio of 1:3 or perhaps 1:2.  The aim is to keep the sprint as close to 100% Maximum sprint speed (MSS) as possible but acknowledging that with only 20-30 seconds rest in between this will be challenging.


What could it look like on-court: (1 player basket fed by 1 coach)

  • This can be 1 player working on their own with the tennis coach using basket feeding so that the player has to sprint from corner to corner and basically everywhere, and get a racket on the ball.
  • Work to rest ratio of 1:3 or perhaps 1:2


Sets and Reps


  • For the stages 1-3 we might be looking to do 8-12 reps of the intervals so that the session is around 10 minutes of “intervals” not including any other work such as warm up and cooldown.
  • For stage 4, owing to the short work and short rest periods we can prescribe with more repetitions of 10-20 repetitions but broken down into 2 to 3 sets.


What is more, this type of training can be done twice a week, with a different stage each day.  For example, stage 1, which can have a more long lasting physiological effect, can be done on one day of the week.  Then one of the stages 2-4, which delivers the results , can be done another day later in the week.”


Hope you have found this article useful.


Remember:

  • If you’re not subscribed yet, click here to get free email updates, so we can stay in touch.
  • Share this post using the buttons on the top and bottom of the post. As one of this blog’s first readers, I’m not just hoping you’ll tell your friends about it. I’m counting on it.
  • Leave a comment, telling me where you’re struggling and how I can help


Since you’re here…


…we have a small favuor to ask.  APA aim to bring you compelling content from the world of sports science and coaching.  We are devoted to making athletes fitter, faster and stronger so they can excel in sport. Please take a moment to share the articles on social media, engage the authors with questions and comments below, and link to articles when appropriate if you have a blog or participate on forums of related topics. — APA TEAM


=> Follow us on Facebook

=> Follow us on Instagram

=> Follow us on Twitter