Monitoring fatigue in athletes
Testing for Testing sake?
Regular readers might remember that I was going to make more use of the Gym aware this training phase- GymAware is a small, portable, and accurate linear encoder which attaches to free weights bars and weight stack machines for measuring power output. I did away with the standing vertical jump and have been experimenting with using the Just Jump mat and the Gym aware encoder for fatigue monitoring:

Gym Aware protocol:
Test: 20kg barbell repeated squat jump x 5 in a row
Measure: Mean External Power (Watts/kg)
Frequency: Beginning of each week (usually Monday or Tuesday)
Just Jump mat protocol:
Test: bodyweight repeated pogo jump x 4 in a row
Measure: Reactive strength index (RSI)
Frequency: Measured on Monday, Wednesday and Friday
RSI – divide the height jumped by the time in contact prior to take-off (height jumped/time).
e.g., 0.3 metres / 0.3 milliseconds = RSI of 1
Measuring worthwhile change:
But rather than just testing for testing sake, I wanted to utilise some statistics to help me decide if I was actually seeing some significant changes in the performances or simply an expected amount of normal variation.
Z scores:
To help me with this I have been recording Z scores for the last 6 weeks of training.
What is a Z score you ask?
A Z–Score is a statistical measurement of a score’s relationship to the mean in a group of scores. A Z–score of 0 means the score is the same as the mean. A Z–score can also be positive or negative, indicating whether it is above or below the mean and by how many standard deviations.
I have been highlighting any Z scores in my raw data with different colours.
-1 to -2: Orange Alert
More than -2: Red Alert
What have I found?
Mean External Power:
Well I haven’t got enough data to use with the Mean External Power yet. I am using it with the pros once a week and over the last 6 weeks I have only got 3 or 4 scores per athlete. Therefore I am thinking about doing it twice a week to get more data.
Reactive Strength Index (RSI):
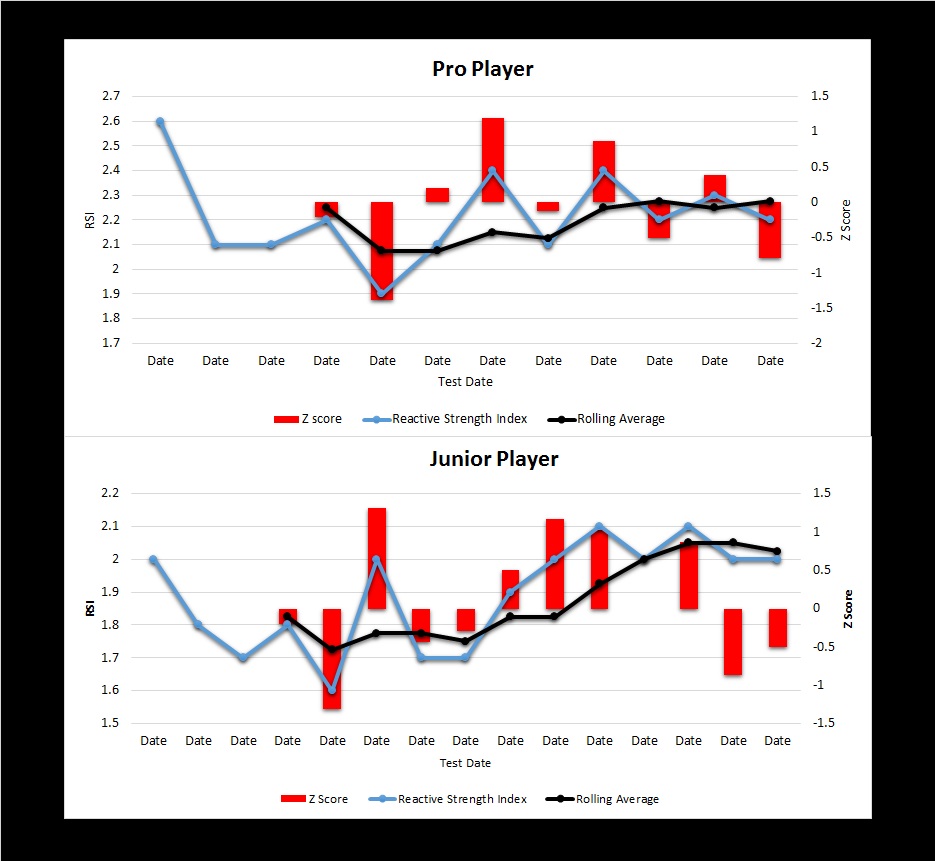
It is still quite early to make any conclusions. The figures below are plots of RSI tracked over a 6 week period.
Rolling Average: This takes the average for the last four entries so has the effect of smoothing the trendline making it easier to see the trend.
Observations:
I was looking for a Z score of -2 or more to indicate it is 2 standard deviations below the mean and indicating a very significant change. It this case it might be interpreted to mean a significant appearance of fatigue.
So far there have been absolutely no reports of scores of this magnitude from any of my athletes.
In most cases the rolling average has had a upward trend too.
What do you do with this data?
It is still early days but with the traffic lighting system of amber and red I plan to make coaches aware by reporting the corresponding Z score with some suggestions for that days training:
Amber (Z score -1 to -2) – cautionary note. Consider slight reduction in training volume up to 25%
Red (Z score >-2)- reduce training volume by 50% for that day.
However, if it is a planned over reaching week such as a training block then the advice may be reported differently versus a competition block where it is essential we try and reduce the fatigue.


