Monitoring Training Load and Fatigue
September madness
If your job is anything like mine then the month of September is all hands on deck as many of our junior athletes are returning from summer holidays, are back to school and are now getting back to their student athlete lifestyles.
Needless to say we have had a lot of athletes to assess over the last few weeks including physical competency assessments, fitness tests and strength/power profiles. With all this data it is important to be able to determine what data is actually useful so that is my focus this year.
Athlete monitoring: Goal 1: Is it any good?
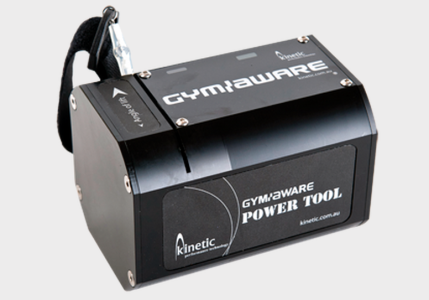
APA has been recording data consistently over the last four years on a range of Fitness test parameters so we know what good looks like in terms of speed, agility, power and stamina. Since APA purchased the Gym Aware linear position transducer to determine power and force parameters I have been keen to use this tool to deepen my understanding of what good looks like!

Based on previous articles and my take away messages from the UKSCA conference this summer my main goal is to determine:
if there is a power achieved at a specific load that differentiates those at pro level from the second string players in the sports I work in.
Tennis: Since I spend most of my own time working in Tennis I thought I would start with that. There are many contributing factors to successful performance in Tennis besides physical attributes. So unlike other sports it may not always be the case that the best athlete is also the best tennis player.
Other sports such as rugby may be better off assessing absolute power at fixed loads of 20, 40, 60, 80 and 100kg.
For example, Dan Baker’s research on professional rugby league players, with whom he worked for 19 years, shows that the power achieved jumping with 80-100 kg really differentiates those at the pro team level (NRL) from second- and third-division players.
But for Tennis I am going to look at relative power first rather than absolute power. So this years’s power profile looks at 0, 20, 40, 60, 80 and 100% bodyweight. I will be investigating if better players produce more power at certain loads.
So far I have profiled our top 3 British Tennis players (all Top 300 world ranked) and their power and force profiles during 1 repetition jump squats look like this:
Athlete 1 was able to generate 78 watts/kg during 20% of his body mass during a jump squat. It doesn’t seem to follow the trend of his profile but for now 78 watts/kg is the highest observed. He is the best athlete (supported by this jump squat profile) and currently is also the highest ranked.
Athlete monitoring: Goal 2: Is it any good- measured against the norm?
It is clearly important to know what good looks like. It is equally important to know how the performance you are observing compares to the ‘norm.’ Is the change in performance significant or simply within the realms of typical day to day variation?
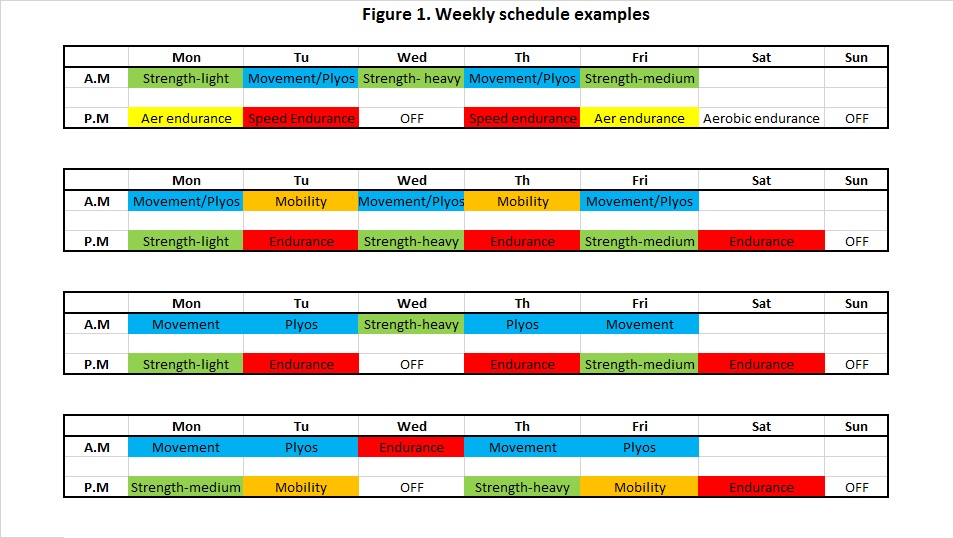
One of the skills of a strength & conditioning coach is being able to plan the training of a professional athlete who is training multiple times per day across both S&C and their sport. Below are a selection of training templates I have either personally used myself or have seen other coaches use.
Clearly the stresses of such a full schedule can take its toll on the body (and performance) of the athlete, so it’s important to monitor this. Perhaps the athlete is not responding well to the volume and/or intensity of the schedule. How can you observe this? And then hopefully do something about it before it becomes an issue?
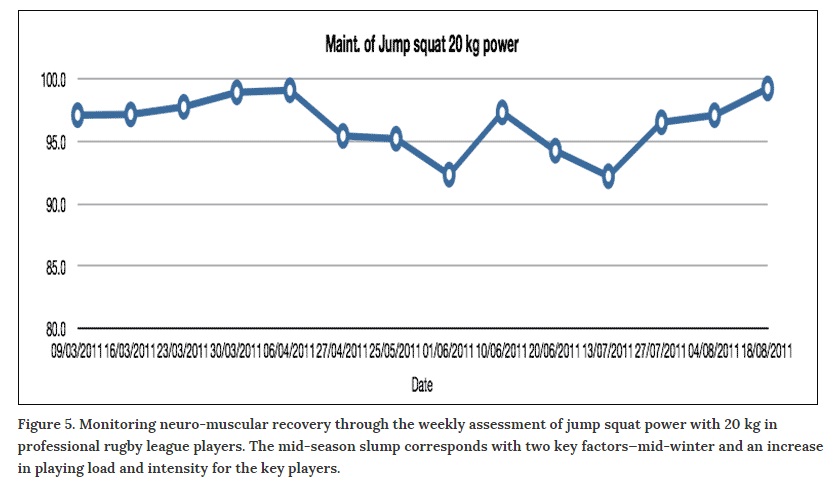
I have already mentioned in a previous blog about this but it is worth referring again to some of Dan Baker’s work he used to monitor neuromuscular fatigue. He used a 20kg repeated jump squat x 5 to monitor mean external power.
Dan says, ”At the end of every power training session warm-up, before the real barbell work started, we would do five jump squats with 20 kg to monitor the state of the neuromuscular system/recovery. An easy test, not fatiguing, and it allowed us to monitor how the squad was coping. A 3-4% deviation (from the best pre-season score) meant nothing. That is just the normal weekly variation, but changes of 7-10+% meant something! If the whole squad is down on average 7%, look out!”
Figure 5. Monitoring neuro-muscular recovery through the weekly assessment of jump squat power with 20 kg in professional rugby league players. The mid-season slump corresponds with two key factors—mid-winter and an increase in playing load and intensity for the key players.
Statistics, Statistics, Statistics!!!
Means, Standard Deviations and Z scores
Mean– The mean is the average of the numbers: a calculated “central” value of a set of numbers.
Standard deviation– A measure of the dispersion of a set of data from its mean. The more spread apart the data, the higher the deviation. Standard deviation is calculated as the square root of variance.
Z–Score – A Z-Score is a statistical measurement of a score’s relationship to the mean in a group of scores. A Z–score of 0 means the score is the same as the mean. A Z–score can also be positive or negative, indicating whether it is above or below the mean and by how many standard deviations.
This year I will be calculating these numbers for our important variables that we believe will be the most sensitive to change during times of fatigue. So I will be taking the Reactive Strength Index (RSI) at the end of warm-ups at 9:45am and then the Mean External Power of a repeated 20kg jump squat during the start of the strength session at 10:30am.
Below is some hypothetical data for Mean External Power for this month
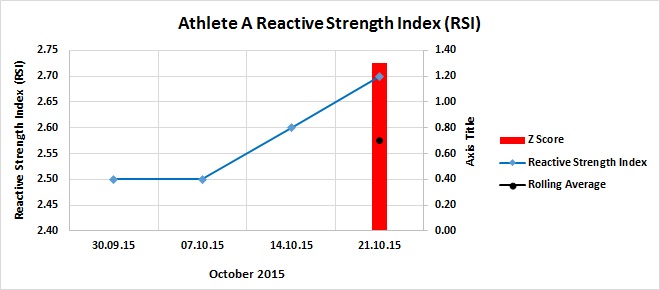
Let’s say the coach asks me if the score on 21.10.15 is significant. As you can see there is an upwards trend in RSI performance peaking at 2.70 on 21.10.15
The Rolling average is 2.58 which takes into account the average of the last four scores
The Z Score of 1.31 shows that the last score of 2.70 is above the mean. Z scores are particularly important when determining significance- when the score has gone above/below the rolling average.
Generally a score of between +/-1 and +/-2 is seen as quite a significant change from the average. (A Yellow Flag).
Generally a score of greater than +/- 2 is seen as very significant.
Therefore the last score would be quite significant in terms of a worthwhile improvement from the rolling average.
How can APA help you?
Fitness testing and programme design
General public remote support packages-athlete copy
If you would like APA to assess your fitness and write you a programme you can do yourself then feel free to contact us. We would love to hear from you.


