Using mean bar velocity to predict 1RM
If you read my post last week you will notice I am going to start measuring the Reactive Strength Index (RSI) during a 30cm drop jump as part of the weekly monitoring with APA athletes. I believe it will be more sensitive than using a standing vertical jump for this specific purpose.
I have also been looking at the use of the Gym Aware linear transducer for monitoring bar speed and the different applications for training. The inspiration for this blog is based on sections I have been reading in a round table discussion- Freelap USA Round table: Velocity based training: for the Full article click HERE
I have summarised some key points below which I hope will help you decide on whether measuring bar speed is for you:
BRYAN MANN:
Training: % 1RM vs Bar Velocity:
If you asked what % of 1RM should you be training at to develop strength-speed, people would tell you around 50-65% or maybe even 70%. But if you tell them a velocity range they look at you like you’re crazy.
If we know we want to develop strength speed, we are looking at 0.75-1.0m/s (40-65ish% of 1RM); for accelerative strength 0.5-0.75m/s (around 65 to 80ish% 1RM); for absolute strength, under 0.5m/s (85-100%). Simply using velocities that correspond to the % of 1RM desired allows you to be right on the load you are utilizing, rather than hoping to be lucky that it was correct on any given day.
MLADEN JOVANOVIĆ:
1-RM Squat Prediction
Long story short, one needs to know each lifter’s MVT (or minimal velocity threshold, a fancier term than velocity at 1RM) for every lift (or use generalized velocities—they can be pretty stable across different lifting abilities). Bench press tends to be 0.15 m/s (mean velocity) and squat around 0.3 m/s (mean velocity). One can then proceed by performing at least 3 warm-up sets with increasing weights (hopefully covering a range of at least 0.5 m/s) performed with maximal effort. Using simple linear regression, one can estimate weight at MVT. This can be 40%, 60% and 80% or 1RM. This can give one a quick estimation of 1RM (i.e. daily 1RM) that could be tracked over the duration of the training block and used to make adjustments if needed, or to basically see how the athlete is reacting to the training (if the goal is to increase 1RM).
Having heard what Mladen had to say above I decided to do an experiment of my own having read a few of his articles on hiscomplimentary training website.
Example: Pro Tennis player
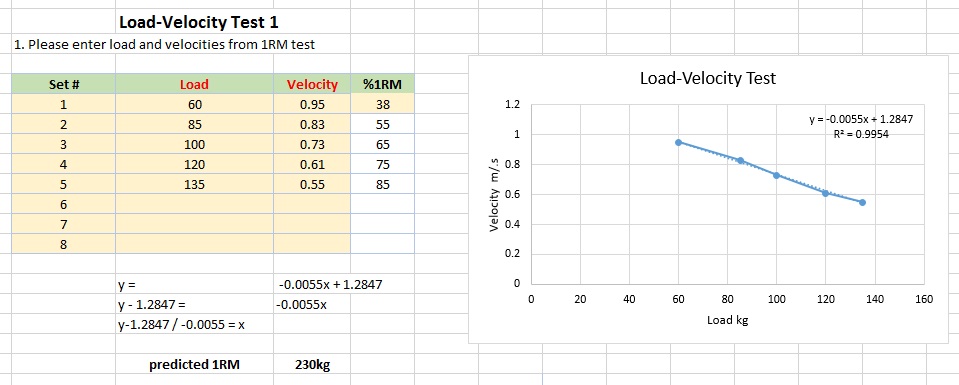
Here is the example of a predicted 1RM test for a pro Tennis player I work with. It’s not the best example and I’ll explain why but it gives you an example of the protocol.
The issue we had with my experiment was that we were ‘in-season’ and doing this between two important tournaments. We hadn’t done a 1-RM recently and given he hadn’t been in a training block for a while we conservatively estimated his current 1-RM at 160kg. This was because his previous pre-season 1-RM was 180kg. Therefore we calculated his 3 warm-up sets with increasing weights (as suggested by Mladen) as 55, 65, 75 and 85% of 160kg. The better solution is to have a more recent 1-RM to base your warm-up sets on. But as we only had a few days training I didn’t want to risk overloading him so I just guessed he would be around 160kg.
For those of you like me who are not mathematically minded I have rearranged the linear regression equation you can get in excel. If you know the value of Y (0.3 m/s) which is the bar speed at 1-RM you can insert this value into the equation:
0.3- 1.2847 / -0.0055 = 179kg
As you can see I was able to predict that the athlete’s 1-RM was 179kg. I was therefore able to track his 1-RM without actually having to get him to do it!!!!
One thing I would say is to make this assessment valid and reliable Mladen recommended doing 3 reps at each of the warm-up set loads. He also recommended holding the position at the bottom of the squat for 1-second before lifting back up. This may need some practice to orientate the athletes with this especially at the lower loads where the temptation is to move the bar much faster.
1-RM Power Clean Prediction Example
I have also wrote a blog previously about the application of using the clean pull to predict the 1-RM for a Power Clean. J Strength Cond Res 26(5): 1208–1214, 2012. For the full blog post click HERE
Findings:
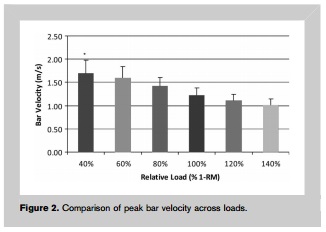
- peak power occurred in mid thigh clean pull at a load of 40% 1RM of Power clean
- this corresponds to a bar velocity of 1.65 m/s
What I found interesting was that the bar velocity which corresponded to 1RM for the power clean was 1.25 m/s so you could load up the clean pull until you get to 1/25m/s and this would give you an idea of their power clean load.
The final section below discusses some further considerations when selecting exercises that are appropriate for training and testing power.
DAN BAKER:
Difference between a Strength exercise and a Power exercise:
Despite the same sort of % 1RM (sets working from about 70 to 80% 1RM), the mean velocities are much different. For the snatch push press, the velocities are around 0.8 to over 1 m/s. For the heavy squats, 0.3 to 0 .5 m/s. For the snatch push presses, the velocities remain fairly stable, despite the increase in resistance for each set. For the squat there is a decrease in velocity with increased resistance.
Strength exercises have a deceleration phase at the end of range when resistances are low (< 50% 1RM)= to avoid stressing the tendons and joints. On major strength exercises like squats, bench presses, and deadlifts, with resistances below 50% 1RM, more than half the ROM is spent in deceleration, making them less than ideal for power training even though at this low level of resistance the velocity may be high. The length of the deceleration phase decreases as resistances go above 65% 1RM. By 85-90%, there is no real deceleration phase, but the velocities are so low at this level of resistance that they cannot be classified as power exercises. So using light resistances below 50% 1RM in traditional strength exercises to develop power is often counterproductive as it is training the body to decelerate for much of the ROM, rather than continuing to accelerate.
So we do strength exercises with heavy resistances to develop force/strength, and power exercises with the appropriate resistance to train the body to use force with high velocity until the end of range. If you want to use “strength exercises” to develop power, you need to use resistances of 50-70% 1RM. Something to dampen the ferocity of a rapid lockout (such as bands and chains) also helps.
In addition, there are two measures of velocity and power—the mean or average of the entire range of (concentric) movement, and the peak, which represents the highest velocity in the shortest measuring time (say 5 millisecs). So there will be a difference between the two measures. When someone is doing a lot of end-range deceleration (because they may be trying to lift 30-40% 1RM in a bench press explosively), there will be a marked difference between the two figures as the body has to severely decelerate the lock-out to protect the joints. In Olympic lifts, which are virtually full ROM power exercises, there should not be a huge difference. If there is a more marked difference for one athlete compared to others, it suggests that they are decelerating near the end of ROM.
Why would they? Because they have mobility or technique problems and the body inherently knows not to continue accelerating (or at least, lifting with high velocity) until catch or lock-out. It may be dangerous to the involved joints, tendons, etc. So there may be a high peak velocity, but the body will slow down the speed to avoid dealing with high force and high velocity at a vulnerable end of ROM in athletes with mobility/injury concerns.
This may suggest that you don’t perform the full versions of the Olympic lifts (or power versions) with athletes who have mobility problems. You may be better off performing a variation (for example, clean power shrug jump instead of power/hang clean).
More than 20 years ago, Greg Wilson called this point—where mean power is highest—the “optimal power load.” It is different for every exercise and there is also individual variation. Some of my published research looks at bench press throws in a Smith machine by professional rugby league players. That “optimal power” (mean power of the entire concentric range) was 55% 1RM for weaker blokes (about 125 kg 1RM), 50% 1RM for the across- the-board normal blokes (about 140 kg 1RM), and 45% 1RM for the strongest blokes (about 150 kg+ 1RM).


