
Are Top 10 ranked tennis players better athletes than Top 100 ranked tennis players?
In case you missed it
At the start of this year I wrote a two part blog on the Speedworks Linear speed and COD reports. You can read the full blog articles here and here
In today’s blog I felt it was time to update you on my latest reflections as it’s been a while since I last wrote a blog and as you’ll see shortly, some of the new insights I have been able to gain on our athlete’s linear speed and COD ability has been really useful in light of what I’m about to share.
For any of you who have read my blogs over the years or followed my career, you will know I’ve been involved in tennis since 2004 and throughout my career I have always been fascinated by the relationship between tennis ranking and physical fitness. In a sport like tennis it is not as simple as equating fitter, faster, stronger with higher ranking, right?
Before I give you my latest thoughts on the matter, it will probably help with a bit of context of what good looks like in terms of acceleration and deceleration ability as I’ll come back to this later. So I’d encourage you to read below where I explain a bit more about deceleration ability. If you have read my previous Speedworks blog series then feel free to skip past it, and go to the section “Early 2000s.”
COD Ability
Researchers like Damian Harper have done so much to help coaches like myself visualise what is going on in deceleration during a 180 degree cut.
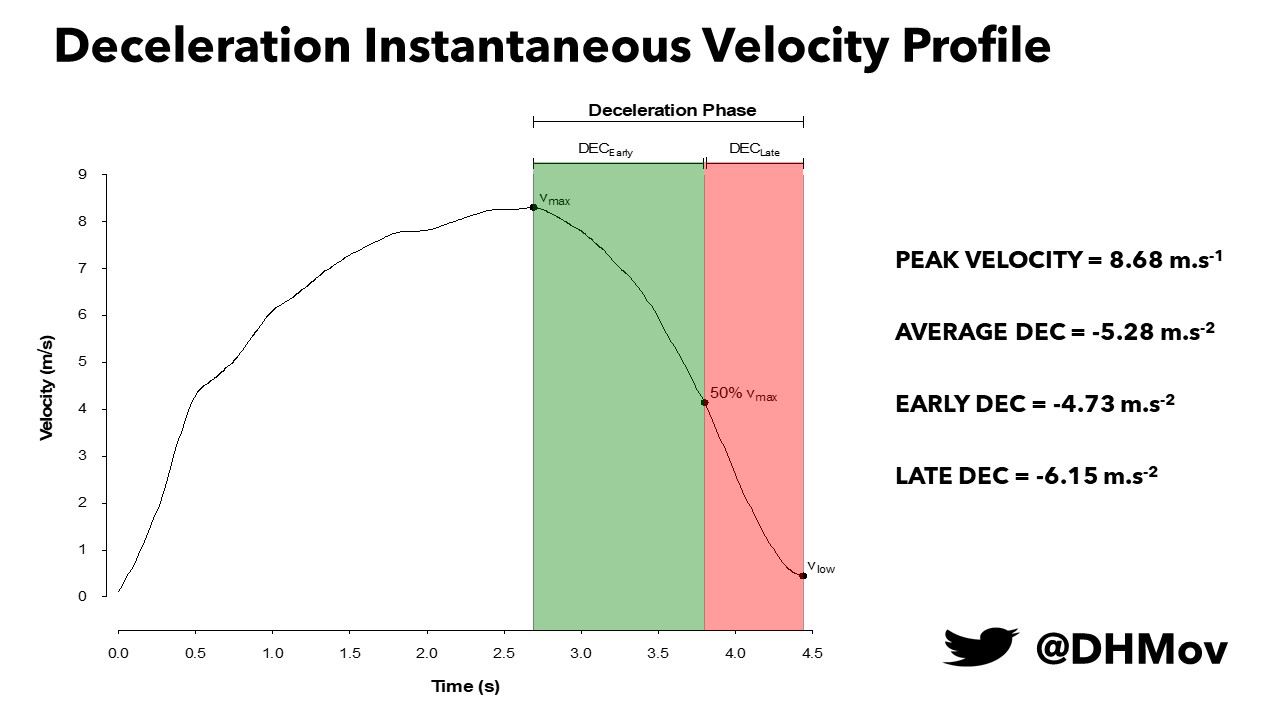
In the research they break the deceleration phase into EARLY vs LATE. Basically, the point where you are no longer accelerating and increasing your velocity is known as your max velocity. This also signifies the start of the deceleration phase. Researchers have split the period from max velocity to lowest velocity into two phases (Vmax to 50% Vmax is EARLY phase; 50% Vmax to Vlow is LATE phase).
When researchers talk about good deceleration ability they talk about doing more of the deceleration in the “early phase.”
The moment you choose to start decelerating we want you to slam on the brakes EARLY and HARD! No matter how good you are at decelerating the late deceleration phase will have a higher rate of deceleration. But we are aiming for a ratio as close to 1:1 as possible.
If you do slam on the brakes HARD you should also have an overall higher average deceleration. From my personal experience, you want this number to be 6 m/s2 or higher. For the S&C coaches out there we are talking about coaching interventions that will promote high rates of eccentric force absorption.
Simple enough right?
Here’s where it gets complicated.
When coaches talk about good deceleration, they talk about stopping “later” in the approach.
So in terms of stopping distance, they want this to be smaller as this indicates you have started braking later in the run. Can you see how the use of the words early and late could be confusing, depending on whether you are referring to the deceleration phase or the distance out from the COD?
I have told my coaches that since most athletes will not be aware of this EARLY vs LATE deceleration phase concept, focus on the words LATER, HARDER, FASTER. Conceptually athletes can understand what you mean by stopping “later” in the 10m approach. Our best athletes are able to slam on the brakes from 3 metres away from the turn at a speed approaching their 10m sprint speed. See below for our elite norms.
Try to remember this average deceleration concept later. But for now, back to my reflections on Tennis. I’ve had four moments in my career where I’ve tried to make a link being ranking and fitness. My curiosity for what explains winning performance in tennis and the part that physical capability plays has been a big driver for my love of the sport and why I have stayed in it for so long. For part 1 of this two part blog, I’ll describe the first three moments and I’ll save the best one for last in part 2 coming soon.
Early 2000s
During this period I was working with a few British male pro players who were invited to a pre-season winter training camp at the National Tennis Centre (NTC). It was a rare opportunity where about a dozen athletes were split into groups according to their training needs. What can only be described as an approach approximating what they sometimes do in Rugby – the men were put in a fit, fast or fat group. Now of course, these were all elite male tennis players (the majority of which were in around Top 150-400 in the world at the time) so there wasn’t really anyone who you could say was terribly out of shape, but yes essentially the fast group were the Ferraris of the group and known for being super fast by any standards you would want to use. The fit group were known for their extraordinary endurance with Yo-yo scores all at level 20 or 21. And the fat group, well they were considered in need of a bit of general all round development and would benefit from a little more speed and stamina than the other groups who would be in the gym a bit more doing strength work. I should say that these were NOT the names given to the groups, and it was only for ease of explanation that the National coaches described them this way!! I’m sure you get the idea.
The point is, during the training block the athletes did some fitness tests at the start and at the end of the block, your standard tests, 10m sprints, change of direction tests, jumps, throws, Yo-yo test etc.
The findings – there was no relationship between ranking in the fitness test and position in the professional tennis rankings – said another way; the better ranked players were not better athletes (according to the battery of general fitness tests).
2012-2014
By this time Hawk-Eye technology has been in use for several years in the Grand slam events as its official line-calling system. If you haven’t come across it, it’s a cutting edge ball and player tracking camera technology that provides unique insight into the game demands. The challenge for me was that the data has always been owned by the tournaments, even the players had to pay to have access to their data and it wouldn’t get to them until weeks or months later.
However, thanks to the foresight of the great sport scientists of Tennis Australia and a special shout out to Machar Reid, who has been publishing scientific articles about tennis for as long as I’ve been in tennis, Tennis Australia started analysing the Hawk-Eye data and publishing research on their findings.
In the first study that I ever came across in 2015, “Differentiating top-ranked male tennis players from lower-ranked players using hawk eye data,” I was excited to see what the findings were.
The findings – “with respect to on-court movement, top ranked players covered significantly greater distances during matches than lower ranked players. Similarly, top-ranked players covered greater distances during receiving points than lower-ranked players. Average speed and maximum speed did not differ between groups.
The author added that top ranked players covered greater distances during (1) entire matches and (2) points where they were receiving. This is seemingly consistent with the counter-punching strategy, but could also indicate that top-ranked players (1) recovered to the centre court after each shot, and/or (2) took extra steps to execute strokes from more favourable positions.
Obviously, further research is necessary but these data underline the importance of movement and endurance capacities in professional men’s tennis. In contrast, average and maximum movement speed data did not differentiate top- and lower-ranked players and – when considered alongside the stroke speed findings – presents the possibility that EXPLOSIVENESS IS NOT A CRITICAL DISCRIMINATOR OF ATP RANKING.
At the time I remember having mixed feelings about the article. On one hand it was great to see that there was a point of difference between top ranked and lower ranked players, but on the other hand, it wasn’t what I was expecting. You see, I’ve grown up around football and also paid attention to sports like basketball and the NBA where it has been well documented that oftentimes the best players do less work not more than the rest of the team – think Lebron James, or Lionel Messi in football. I was okay with Machar’s hypothesis – that the best players work harder (3082 m vs. 2498m in a match) in the aspects that matter most, working harder to get in the best position possible to hit a shot, after all, isn’t that the message we champion with all the junior tennis players we work with – footwork, footwork, footwork!??
To hear that average speed of top-ranked players (1.2 m/s) was less than lower-ranked players (1.3 m/s) as well as top speed (6.1 m/s vs. 6.5 m/s); that didn’t make sense to me. If they were doing more work I thought they would also be doing it faster. Because the stories I would hear from GPS monitoring in football (which had been using them since 2004 when I got into tennis, and on a widespread basis in football since 2015) were that lower level players usually did more work – more total distance and a higher percentage of high speed running because they were essentially chasing shadows by being constantly out of position and having to work harder to get in the right place!! I assumed the top-ranked tennis players would have better reading of the game so would be able to cheat a few metres by having a better sense of where to position themselves because they could anticipate where the ball would be going.
So, I guess I sat on those findings and probably continued with my bias that surely top-ranked players had a physical edge on some level, and with that bias took away the idea that the best players “work harder” on recovery and adjustment steps because it probably confirmed my bias and my current understanding of the tennis world.
2019-2021
Fast forward to the Pandemic period. If you have seen any of my socials you will have seen that I embarked on somewhat of an unofficial PhD investigating the physical determinants of elite tennis performance from 2019 to 2023. During the pandemic period in particular, in 2020 to 2021 I went deep into the research across all aspects of the game which I split into: movement demands, serve research, groundstrokes and matchplay KPIs. I kept going until early 2023 when I felt I could make some well researched observations that would inform my company’s coaching methods. I’ve only posted about 40 times since April 2023 on Instagram, when I came to the end of my research and since then I have focused on “simplifying the process of physical conditioning for elite tennis,” a process I have mainly been chipping away at but admittedly not sharing much of my brain fog on my socials in recent years.
I was clear that elite players needed to have high levels of speed, power and agility coupled with a unique endurance capacity to sustain high intensity efforts whilst making skilful shots over prolonged periods of time. It was also clear to me that having our athletes excel in linear speed and change of direction tasks would give us more confidence that they could meet the game demands. I had seen the emergence of acceleration and deceleration data that was coming out of other sports and some of the in-house data collected at the National Tennis Centre (NTC) from British pro men and women, and some data from Wimbledon that the performance analysis team had shared.
That data was suggesting the following for seniors vs juniors:
Junior Wimbledon (three matches QF, SF and F)
- Average acceleration: 4.0 m/s/s
- Average deceleration: 5.2 m/s/s
- 66% of total below 1 m/s
Senior Wimbledon (three matches QF, SF and F)
- Average acceleration: 4.0 m/s/s
- Average deceleration: 4.2 m/s/s
- 63% of total below 1 m/s
Battle of the Brits – in-house tournament organised for British players only at the NTC
- Top 100 female data: Average distance: 7.73m / Max distance:12.62m / Max speed: 7.29 m/s / Average speed: 2.9 m/s
- Elite Men’s data (2 sets plus Championship Tie breaker): Average for 23 singles matches
- Max speed: 6.1 m/s
- High intensity efforts (>2.5 m/s/s – 30 accels / 17 decels)
- Very high intensity efforts (>3.5 m/s/s – 7 accels / decels 11)
- Total high intensity efforts (average 59 – maximum 90)
In our own APA data we were seeing players getting outputs (average acceleration and deceleration) comparable to what I have just shared for Wimbledon when using our 10m and m505 change of direction test data from our speedwork reports. So happy days.
But one thing I wanted to share was that until quite recently the tennis data I have had access to has been on either the average data for the whole match (taking into account all the shots – e.g. Wimbledon) or it has simply been quantifying the “number of efforts” above a certain threshold (2-5-3.5 m/s/s). But what is the higher rate of average acceleration and deceleration on the toughest shots you can make in tennis, and do the top ranked players have higher or lower rates of acceleration and deceleration?
Fast forward to the present day and we have Machar Reid and his team to thank for once again publishing some data from the Australian Open. I’ll save this insight for the next blog. What do you think we will find out?
Hope you have found this article useful.
Remember:
- If you’re not subscribed yet, click here to get free email updates, so we can stay in touch.
- Share this post using the buttons on the top and bottom of the post. As one of this blog’s first readers, I’m not just hoping you’ll tell your friends about it. I’m counting on it.
- Leave a comment, telling me where you’re struggling and how I can help
Since you’re here…
…we have a small favour to ask. APA aim to bring you compelling content from the world of sports science and coaching. We are devoted to making athletes fitter, faster and stronger so they can excel in sport. Please take a moment to share the articles on social media, engage the authors with questions and comments below, and link to articles when appropriate if you have a blog or participate on forums of related topics. — APA TEAM