How to Get Faster- what does world class look like?
In this week’s blog we are summarising some of the points I made on my recent Episode 7 of Daz Dee TV.
A lot of the content is already for everybody to see on this website so I’ll save myself some time and tell you all to go to the Education section of the website and look at the Speed section.
For those of you who just want to get the headlines of the 20 minute show we covered:
- Something to ponder for another show- why S&C coaches need to get better at communicating your message- it’s not just about the ‘what to coach’ and the knowledge, and why do S&C coaches get so concerned with brand equity and self-promotion.
- Definition of speed- difference between speed, velocity and acceleration
- What does world class look like? How fast do the fastest sprinters in the world run?
- What other factors can affect speed
In this episode we are setting the scene for Speed, it’s definition and some factors to consider. In the next episode we will talk about the Means and Methods to actually improve it in everyone!
Definition of Speed
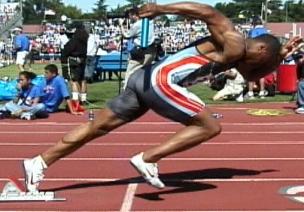
Speed, being a scalar quantity, is the rate at which an object covers distance. Speed is ignorant of direction. On the other hand, velocity is a vector quantity; it is direction-aware.
Speed is the distance covered in a unit of time while acceleration is the rate of change of speed. The unit of speed in the metric system is meters per second (m/s) while that of acceleration is meters per second squared (m/s2). Speed is a scalar quantity while acceleration is a vector quantity.
With respect to the subcategories of Speed I covered this on the Education section of the website so go check out the page for the full definitions.
- Straight ahead Speed
- First step Speed
- Multi-directional Speed
- Sport specific Speed (Footwork)
What does World class look like?
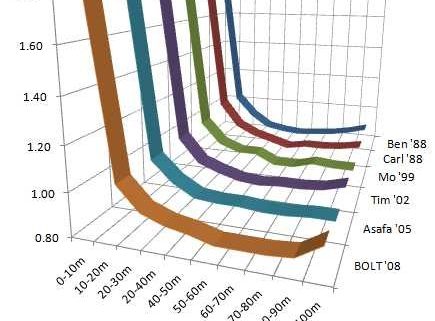
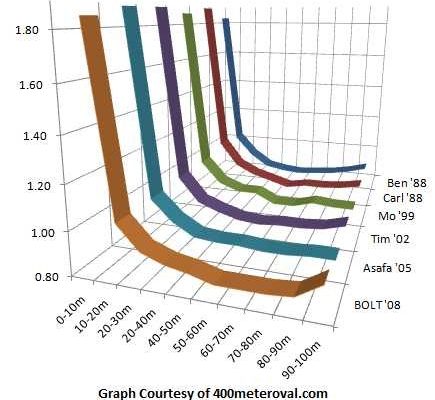
This graph shows a couple of interesting things- it shows two clear phases. The first phase is the acceleration phase. This is defined by a significant drop in the time it takes to cover a 10 metre split over the first 50m or so. When you are no longer accelerating you have officially reached top speed. It is often said that the person who wins is the person who slows down the least so this speaks to the concept of speed endurance. What made Usain Bolt’s word record so amazing was that he was able to hold on to his top speed from 50 to 100m.
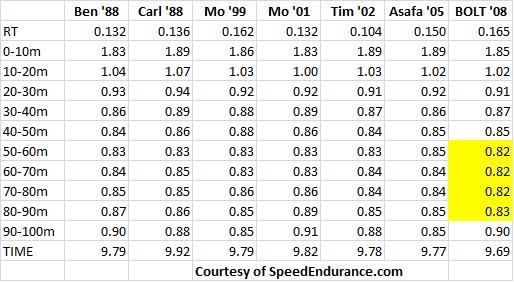
Break down of the splits
The Table above shows the actual data that I was referring to above. The part of the race that no one has been able to compete with was Bolt’s performance of 0.82 m/s from 50-80m.
Until Bolt came along, 0.83 was the fastest top end speed recorded. 0.83 seconds per 10 meters translates to 12 meters per second (m/s) or almost 27 miles per hour (mph) or 43 kilometers per hour (kph).
Tennis Players versus Sprinter
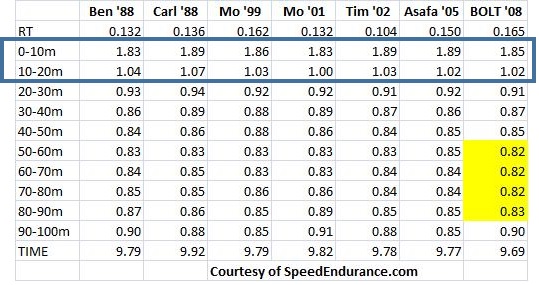
In the Table above I highlight the first 0-20m splits. If you look at Mo ’01 he was fastest over 20m taking 1.83 seconds to cover the first 10m and then 1.00 to do the next 10m. This gave him a total time of 2.83 seconds.
The fastest time I have ever recorded for a tennis player was 2.73 seconds!!!!!!
What other factors affect Speed?
Any performance you evaluate needs to take into consideration
=> Mental
=> Physical
=> Tactical
=> Technical
Before you jump to conclusions that someone who ‘appears’ slow is actually in fact slow, test some of your assumptions. Perhaps they are not mentally ‘focused’ and concentrating. Maybe they are not showing the desire to try hard and run as fast as they are physically capable of. Are they starting in the right place and do they have the most efficient technique??
What next?
If you would like to discuss these topics in more detail then come along on June 4th to my next Speed, Agility & Quickness for Sports workshop. Book online HERE

